Article:
This is really big that Apple and Google collaborating…. https://www.inc.com/jason-aten/apple-googles-covid-19-tracker-is-a-game-changer.html
Time for acceptance big brother is watching if you choose to have a cellphone.
“The basic concept is that you would be able to download an app that would ping off other mobile phones that you come into proximity with.
If you were to later test positive for Covid-19, you could indicate as much on the app, which would then notify the owners of the other devices you came in contact with that they were potentially exposed.”
“the Bluetooth technology that Apple and Google are working on isn’t that different than what Apple already is using for its Find My service. That service uses Bluetooth to send out signals, even when your device has no service, or isn’t connected to the internet. Those signals are relayed by other close-by devices, which then forward them to Apple’s servers. Since the entire system is end-to-end encrypted, not only can’t bad guys get access to your location or personal information, not even Apple could identify your device location. Only your Find My account. The technology behind contact-tracing works in a similar way.”
Hmmmm could we also use this technology to expand advertising relationship to people who associate with each other….or find hot spots for hate crimes….meetings of clubs…etc…
Today I wanted to delve into the message of testing and that testing should be the priority….to a point I agree IF this is focused on ONLY to understand the extent. However when we do polling/sampling we DON’T do everyone because there is diminishing return as the results don’t change typically at some point. When the curve of those confirmed per testing keeps producing consistent results testing to confirm the inevitable could be misallocation of capital (human and monetary).
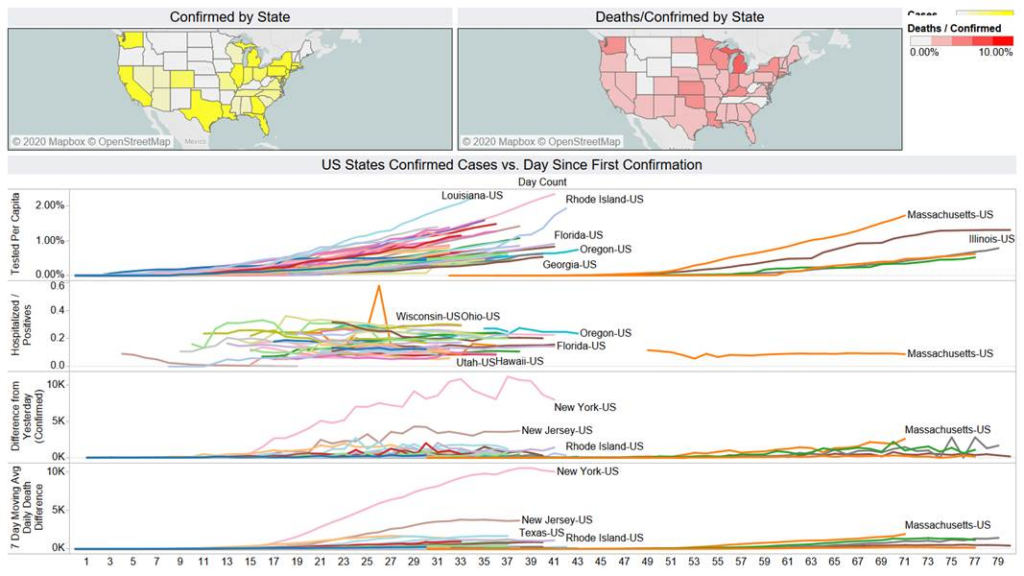
NY obviously done the best in terms of testing (2.2% per capita now tested). The difference between the data curve fit from 0.5% per capita to 1% per capita to the data from 1% capita to 2.2% – the difference in projection for confirmation testing 500K is less than 1%. Consistent results for everyone being tested – unless perhaps they keep testing the same sample over and over- then we are not learning much.
Now using the testing to identify hot spots and actively tracking and pinpointing areas to quarantine like S. Korea – that’s one thing. However this is not being done – we seem to be testing in order to get the data to understand the extent. You don’t need to test ALL to understand the extent – but you do need to get up to a certain percent to get a good understanding on the volume infected – NY and NJ case that’s around 1%. Interestingly if you trust the data… estimates 43% of NY is infected if all 19 million tested. 15 states over 1% per capita now. However some of those states you are not seeing a flattening yet Delaware, Rhode Island….Whereas states such as TX at 0.5% per capita tested has been quite consistent. Current data for TX expected 7-10% of population infected.
Delaware curve looks scary as they have tested over 1% but no break in increasing test…

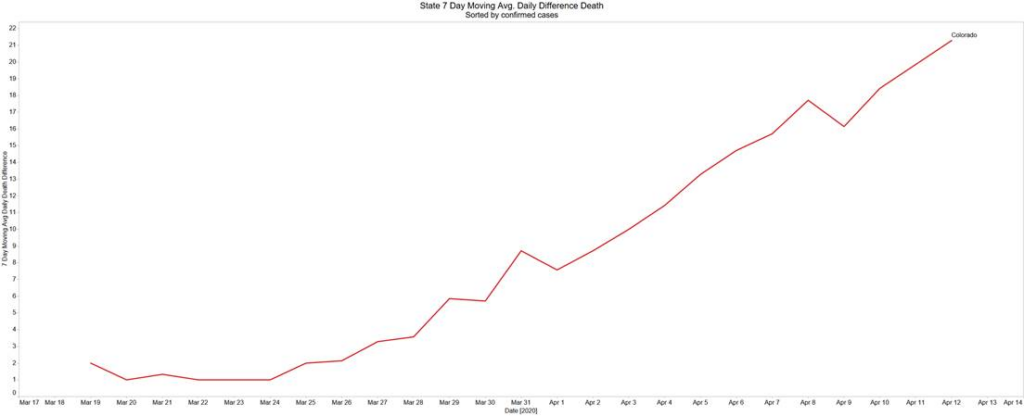
Continued discussion on https://covid19.healthdata.org/united-states-of-america/colorado Still not right in my opinion….does this chart look like its peaked- Colorado 7 day avg daily difference… The only positive thing on Colorado their confirmed case per tested has broke similar to TX at 0.5% tested. Still very low testing and doesn’t show peaking as suggested by the site.

Weekend reporting subject to lack of reporting….

NY and NJ potentially reach peak for deaths per day.

Based on 7 day moving avg. daily death difference Italy, Spain, Iran, Germany, NY – all peaked. The new areas of rising UK, Belgium, and India. The UK PM was lucky as the death/confirmed in UK approaching Italy over 12%.
