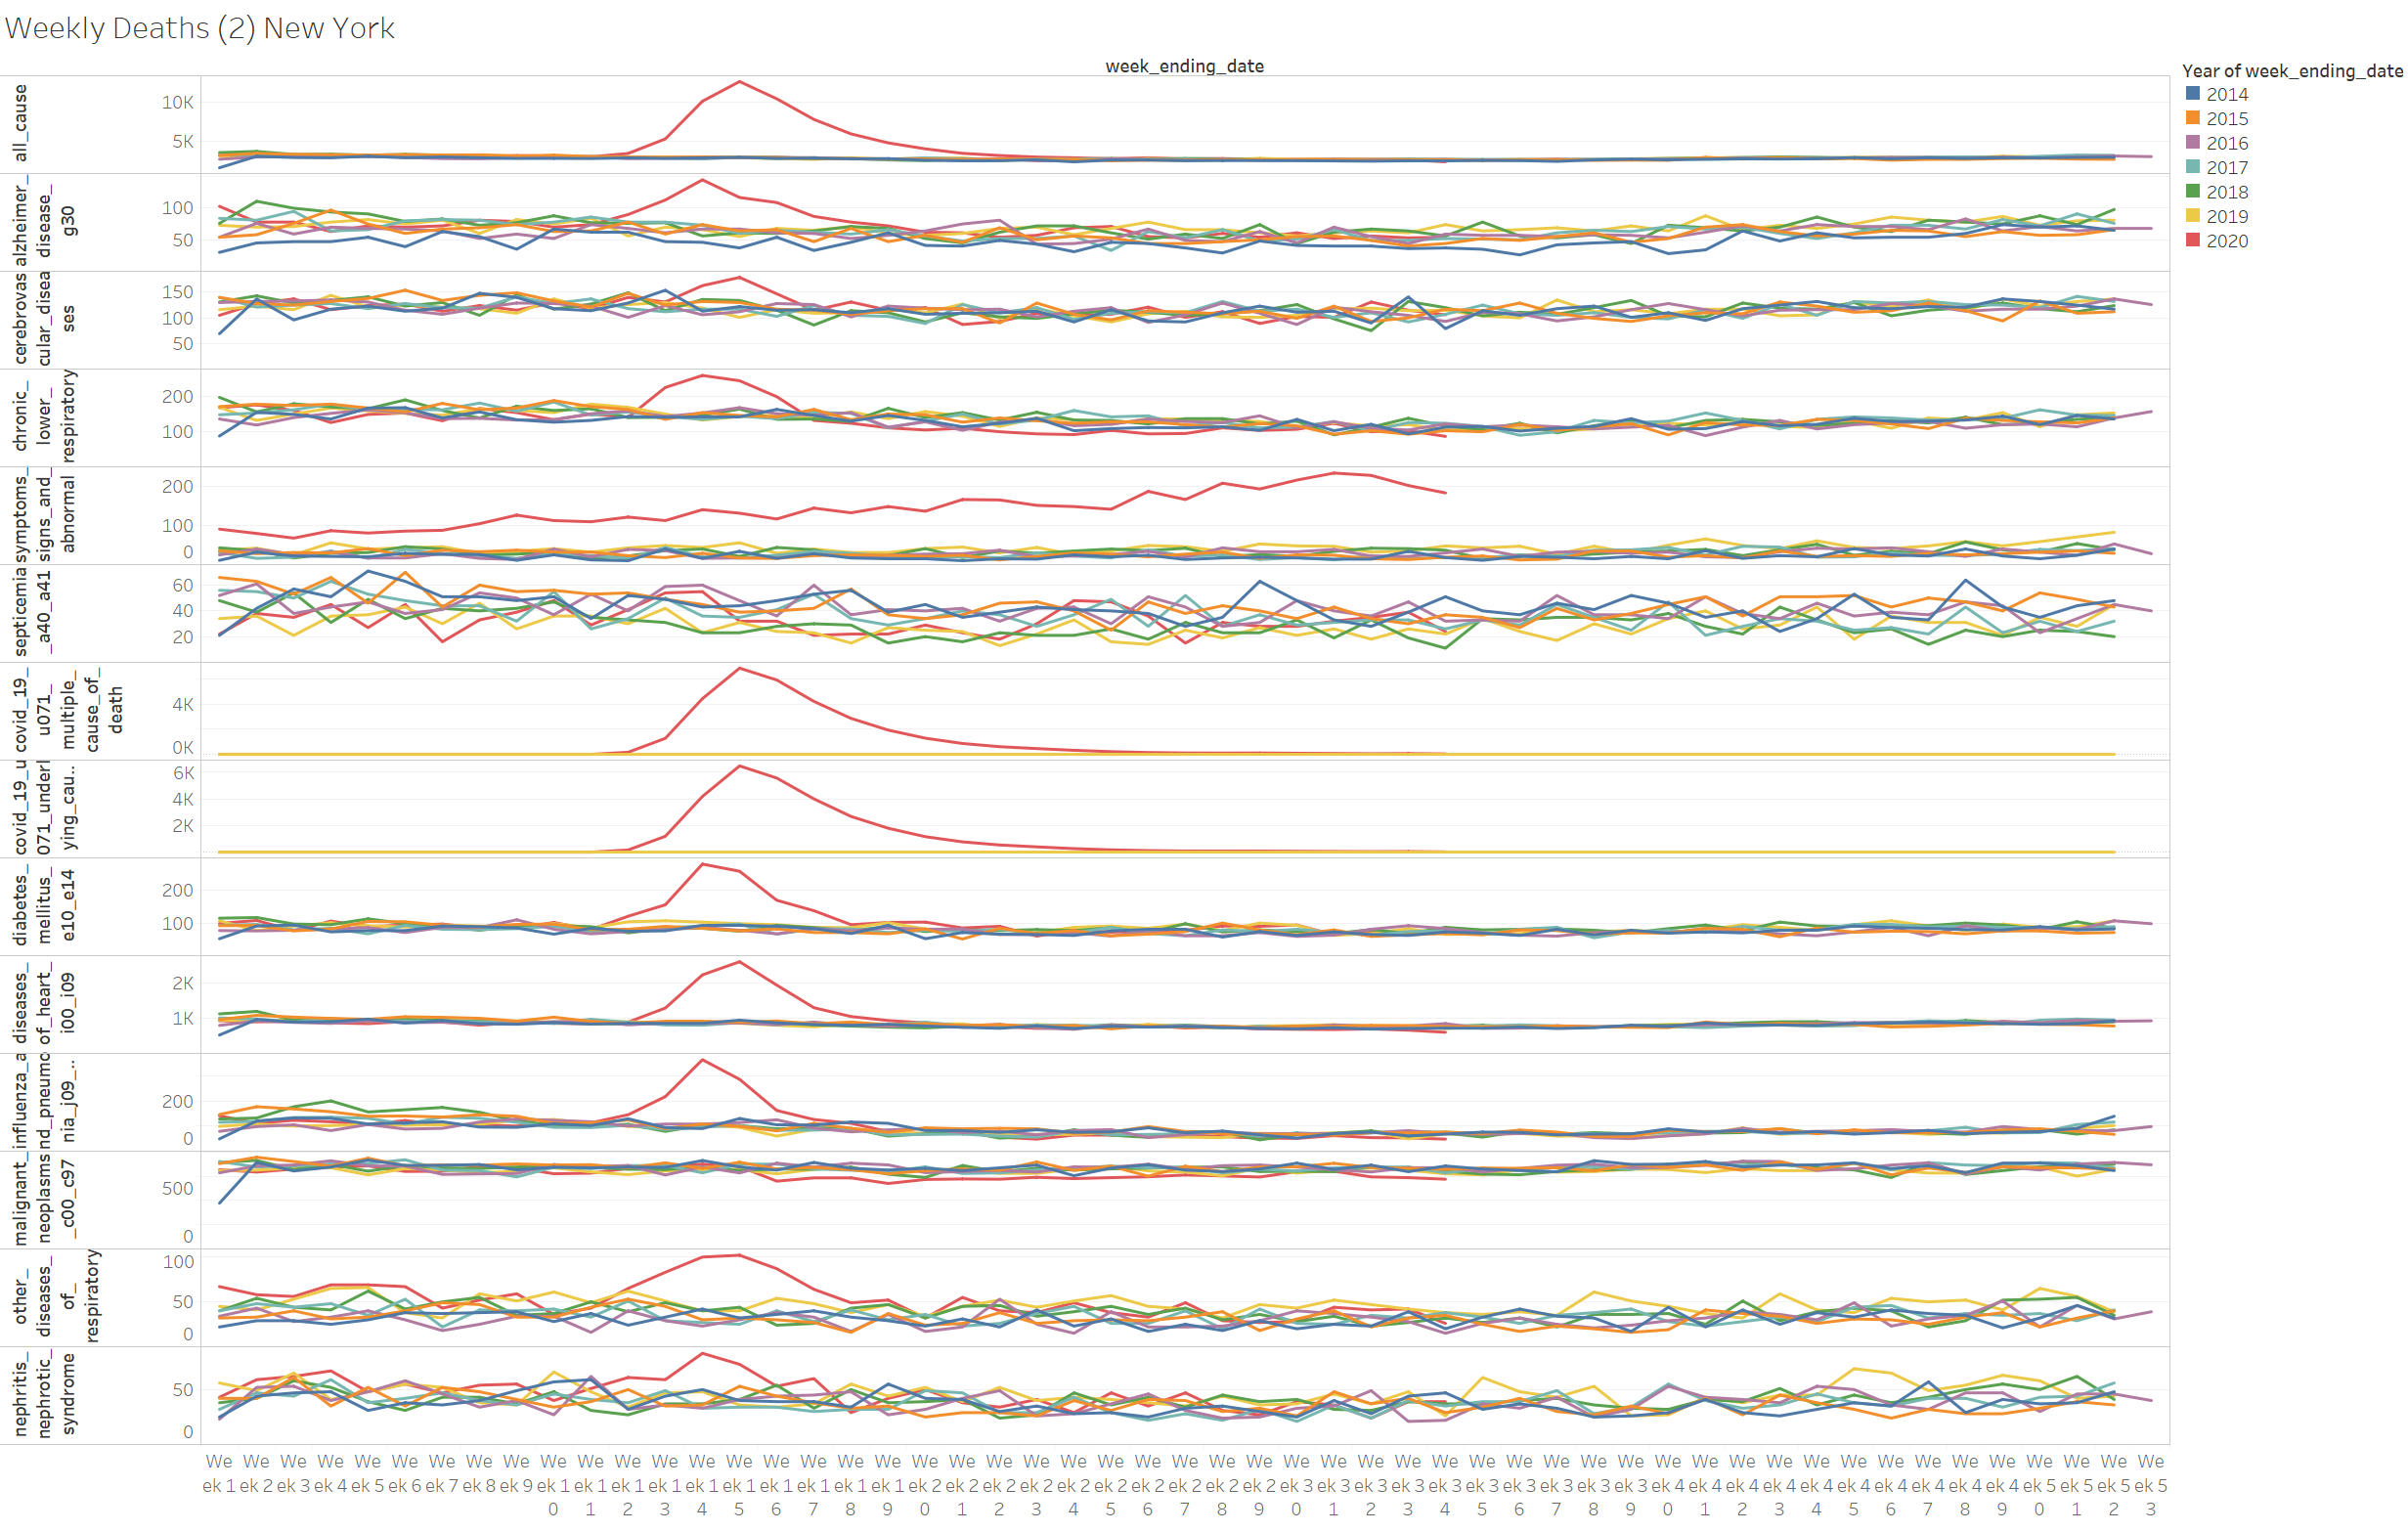
Death reporting is generally dumb down to high level numbers as the general public is perceived to not be able to handle all the details and numbers – also its hard to display and write about it. However if you do look at the detail it does clear some of the conspiracy concerns. Below is NY weekly deaths by the various categories. Lots to look at but the key is to look where the red line is relative to the other lines – if outside the range of the other lines – then 2020 is an outlier and there is something going on above the normal. This is not a normal year. You can see the spike in all categories – what is interesting but not talked about is the death from symptoms signs and abnormal – this divergence starts at the beginning of the year and still sustain itself above the rest of the year.
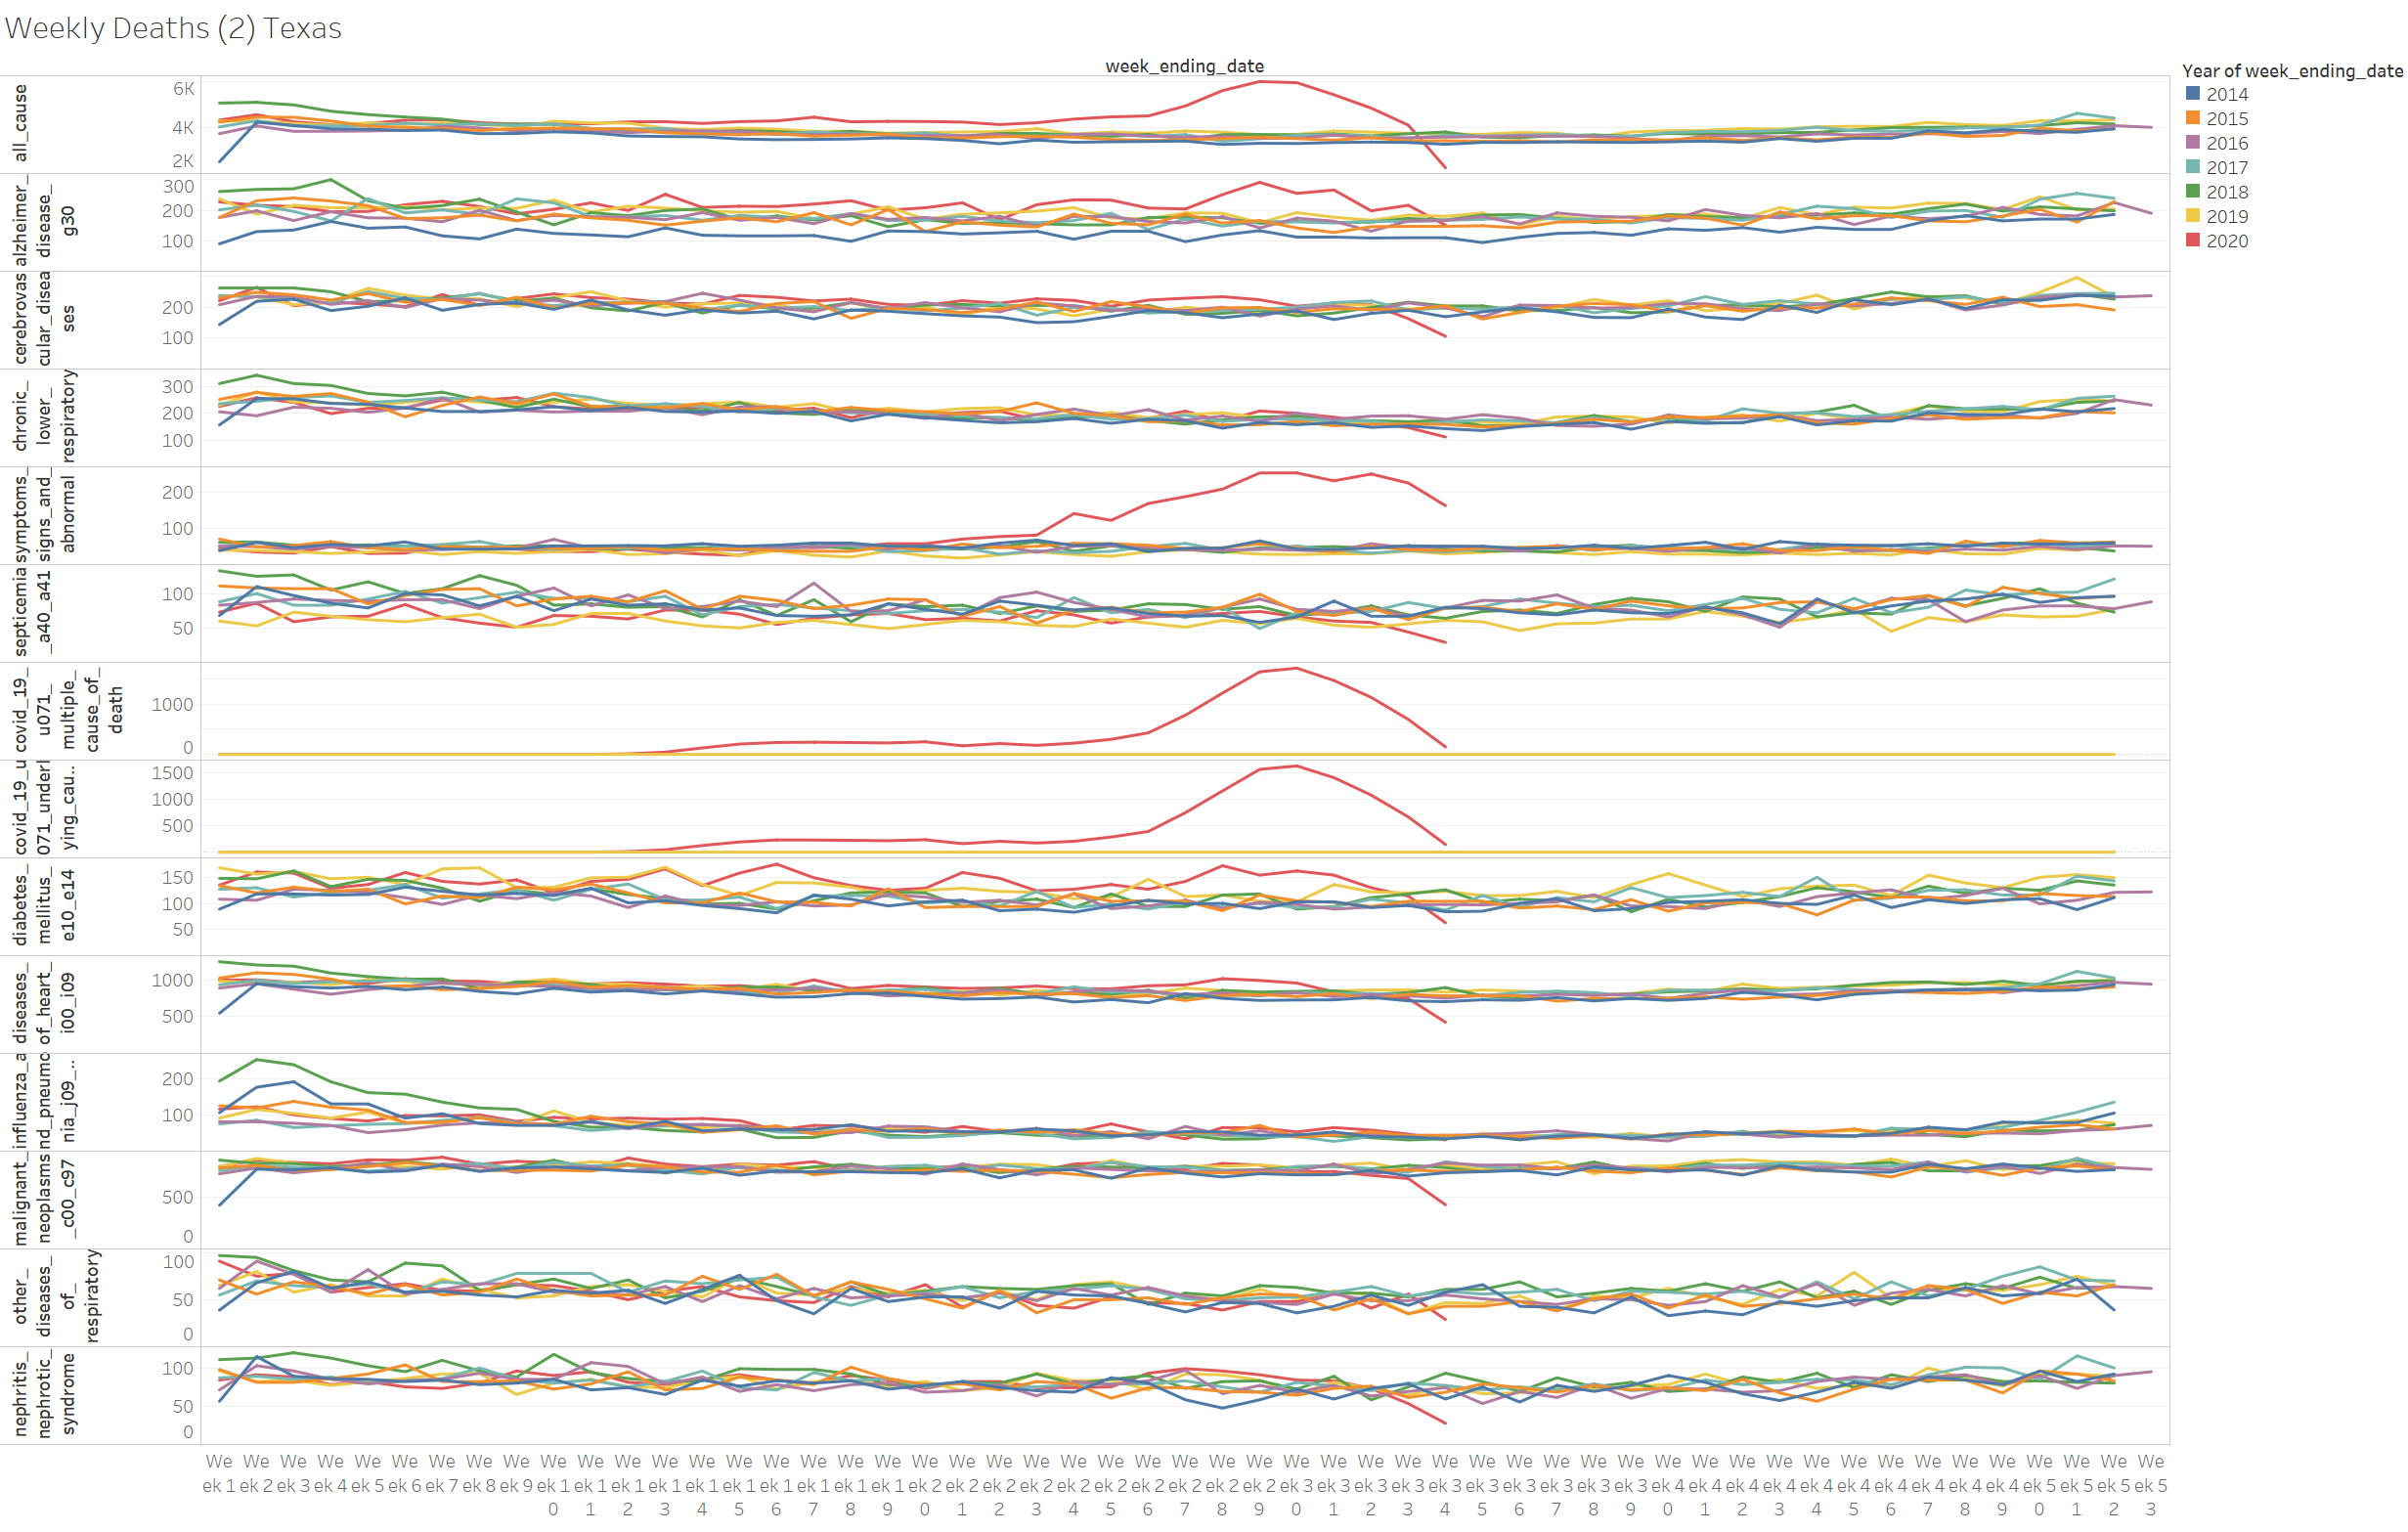
Even in TX we see the same unique issue with symptoms signs and abnormal but only starting slightly ahead of the covid bump – if they wanted to overreport covid one could easily put this into covid.
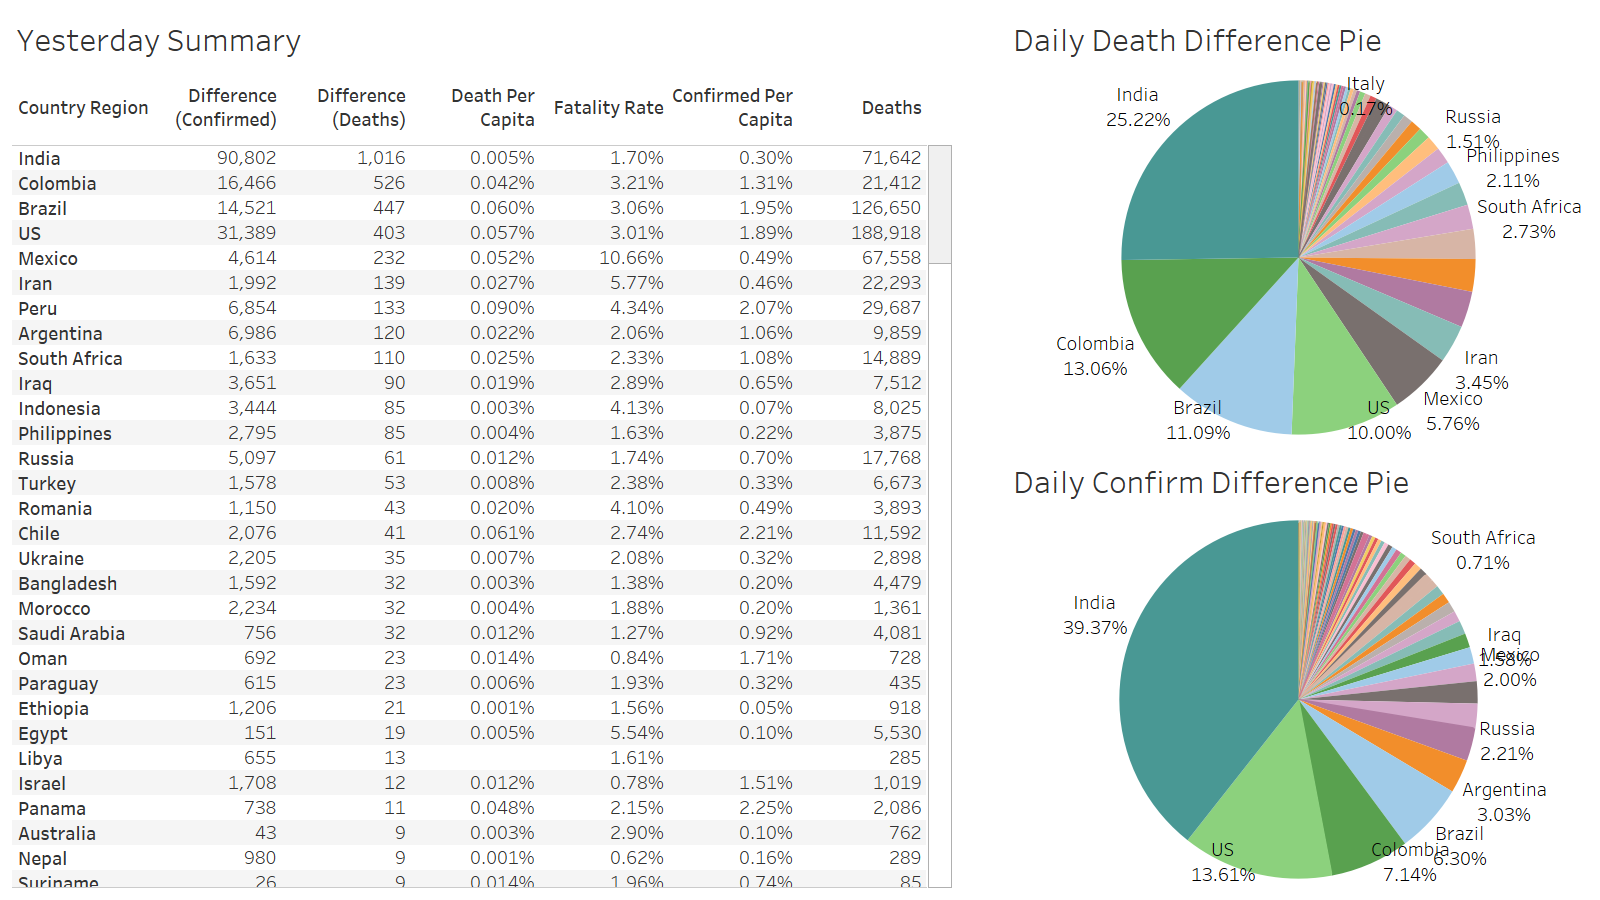
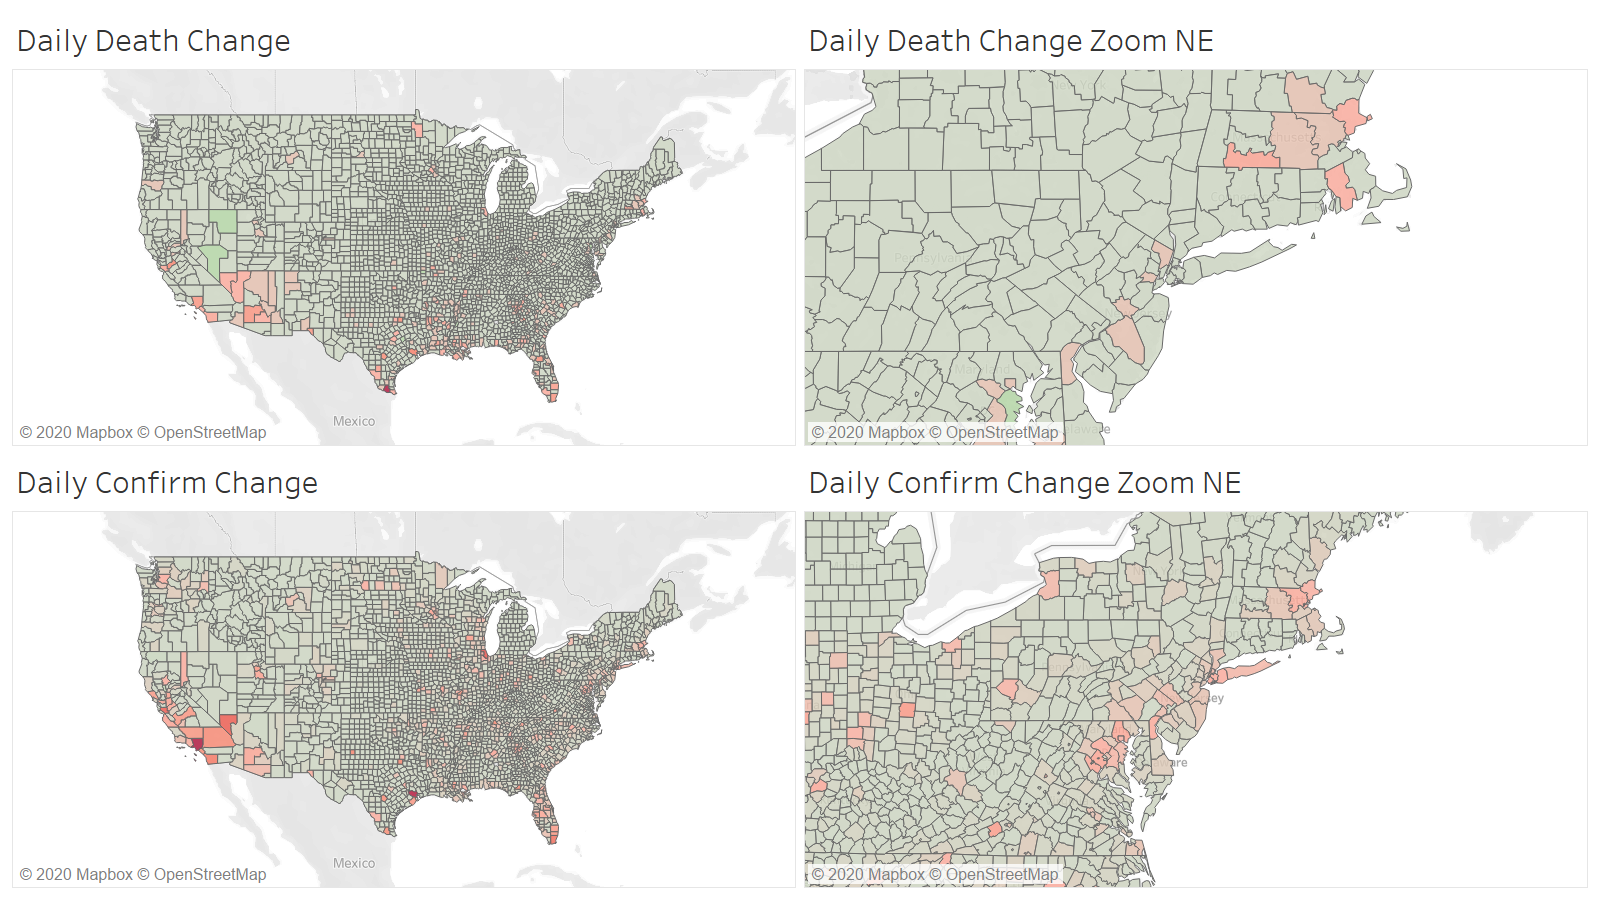
US death only 403 – but it’s a weekend report
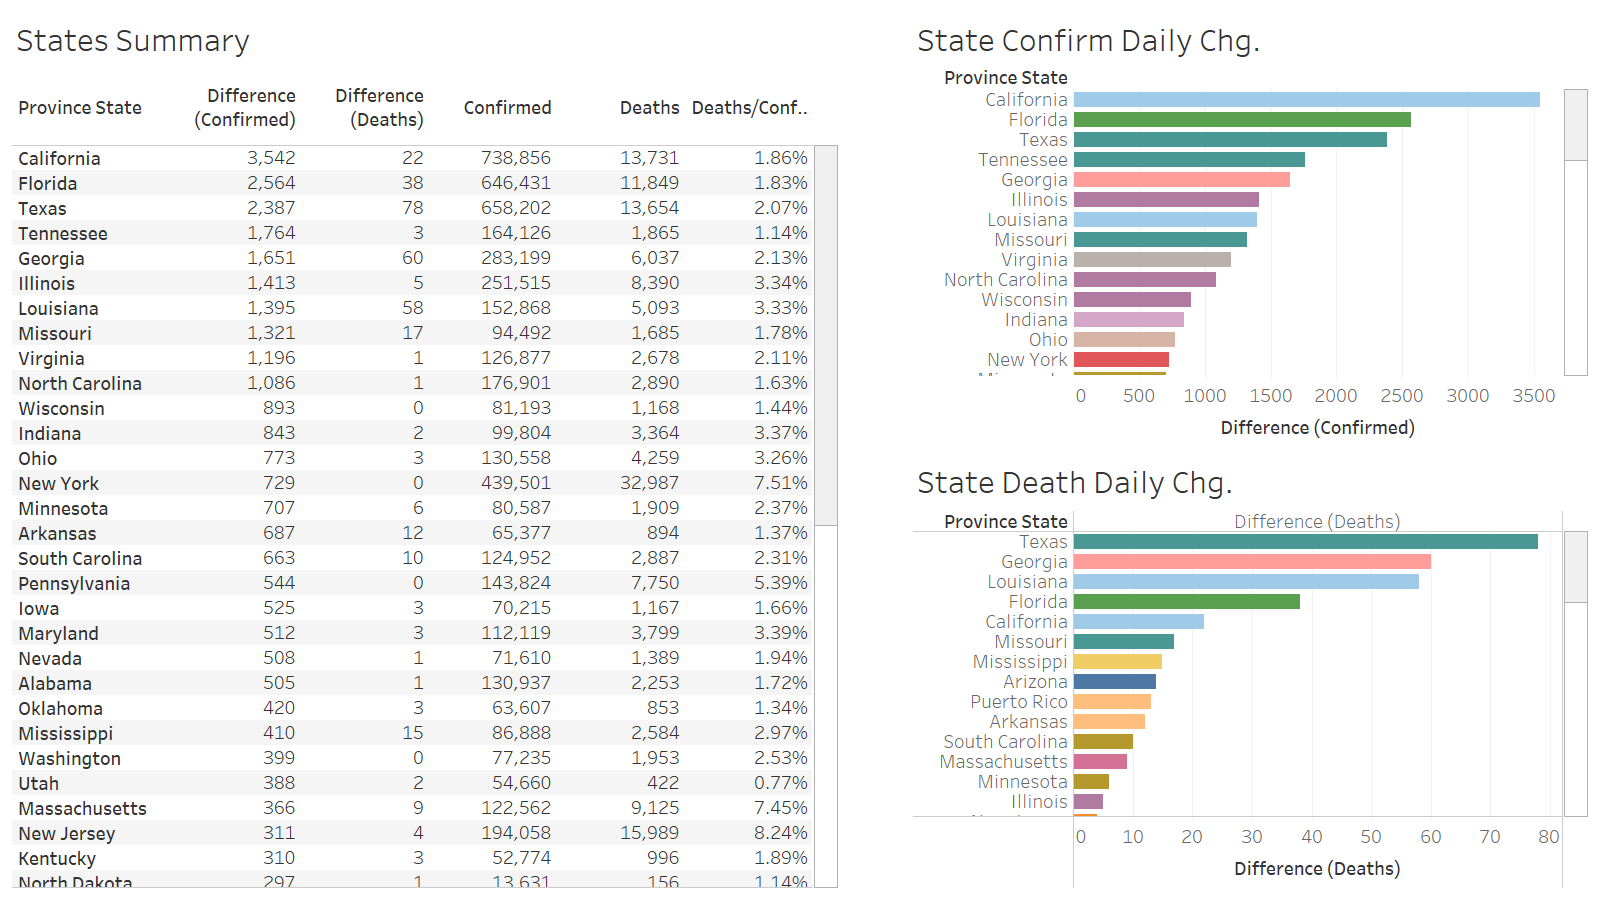
TX leads at 78 deaths in the US
The leading county is Hidalgo TX – border county at 22
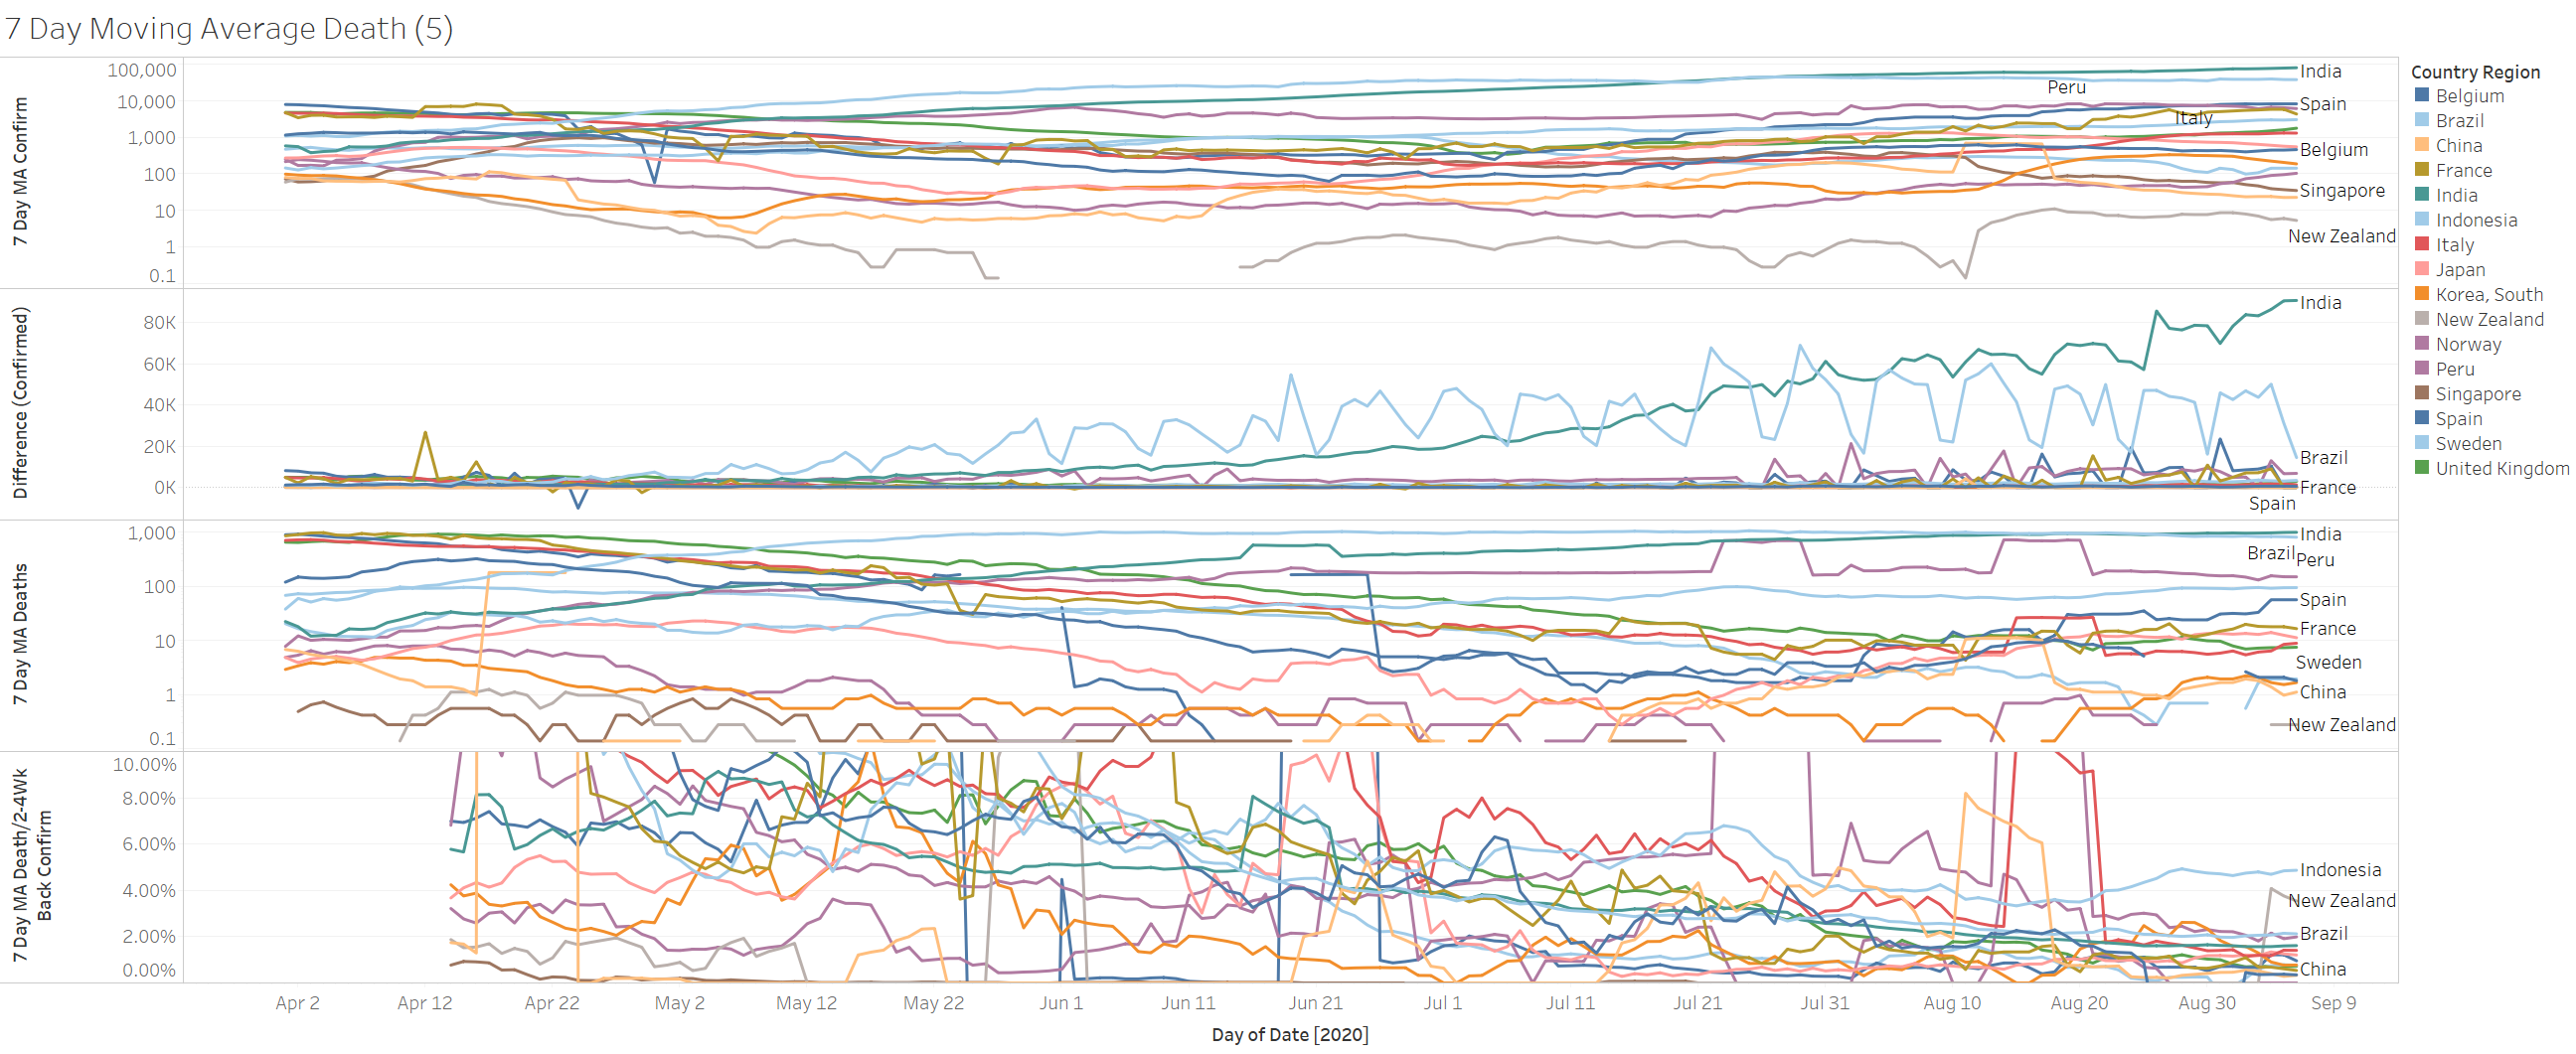
There are lots of strict rules in New Zealand – plus being naturally on an island and yet they cant still get the confirmation to 0. We need to accept the inevitable and adapt.
