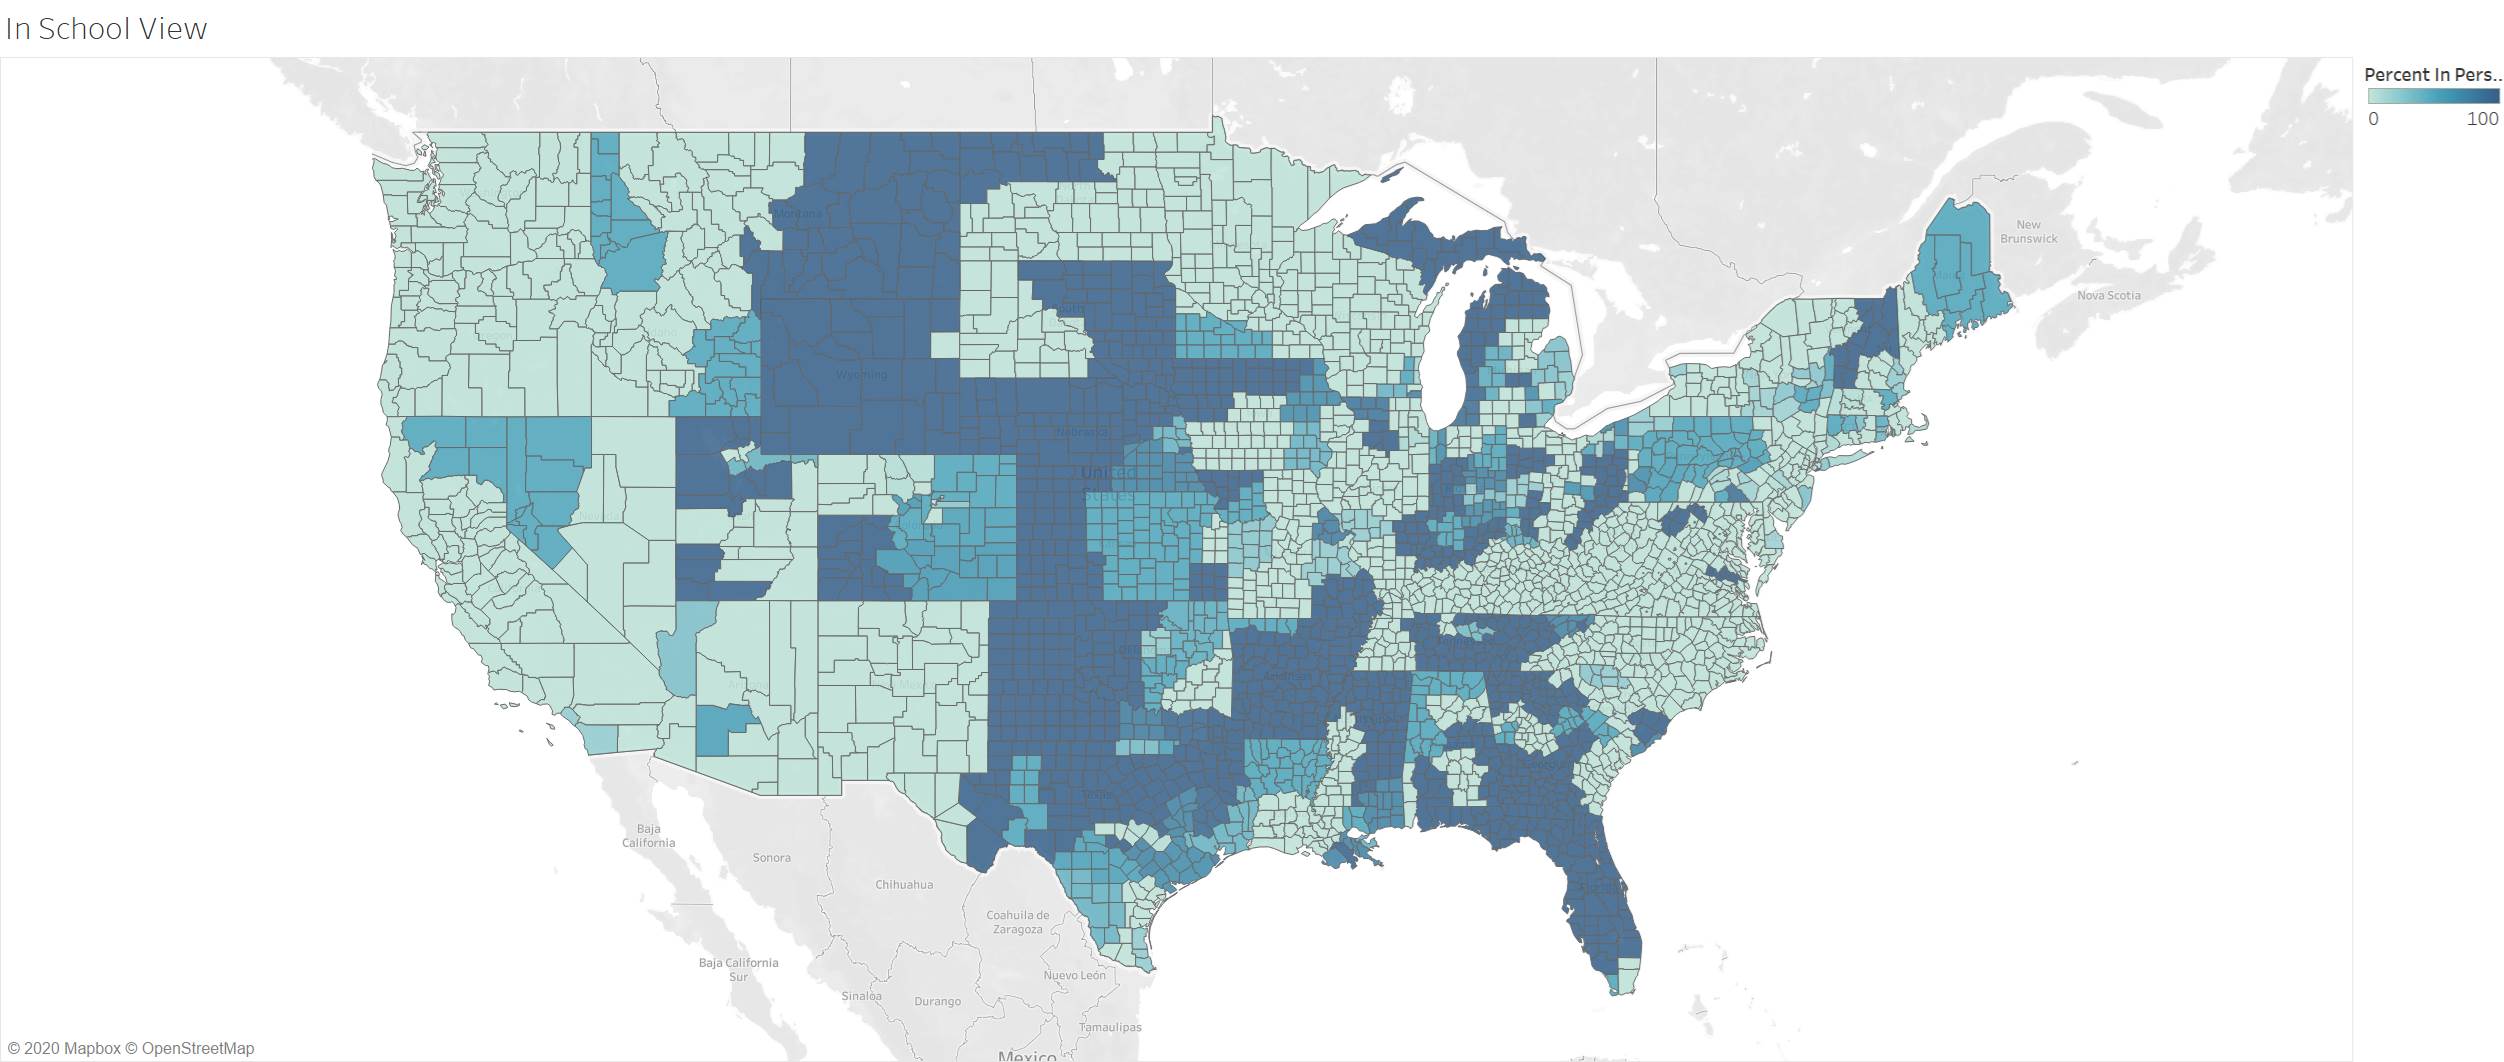
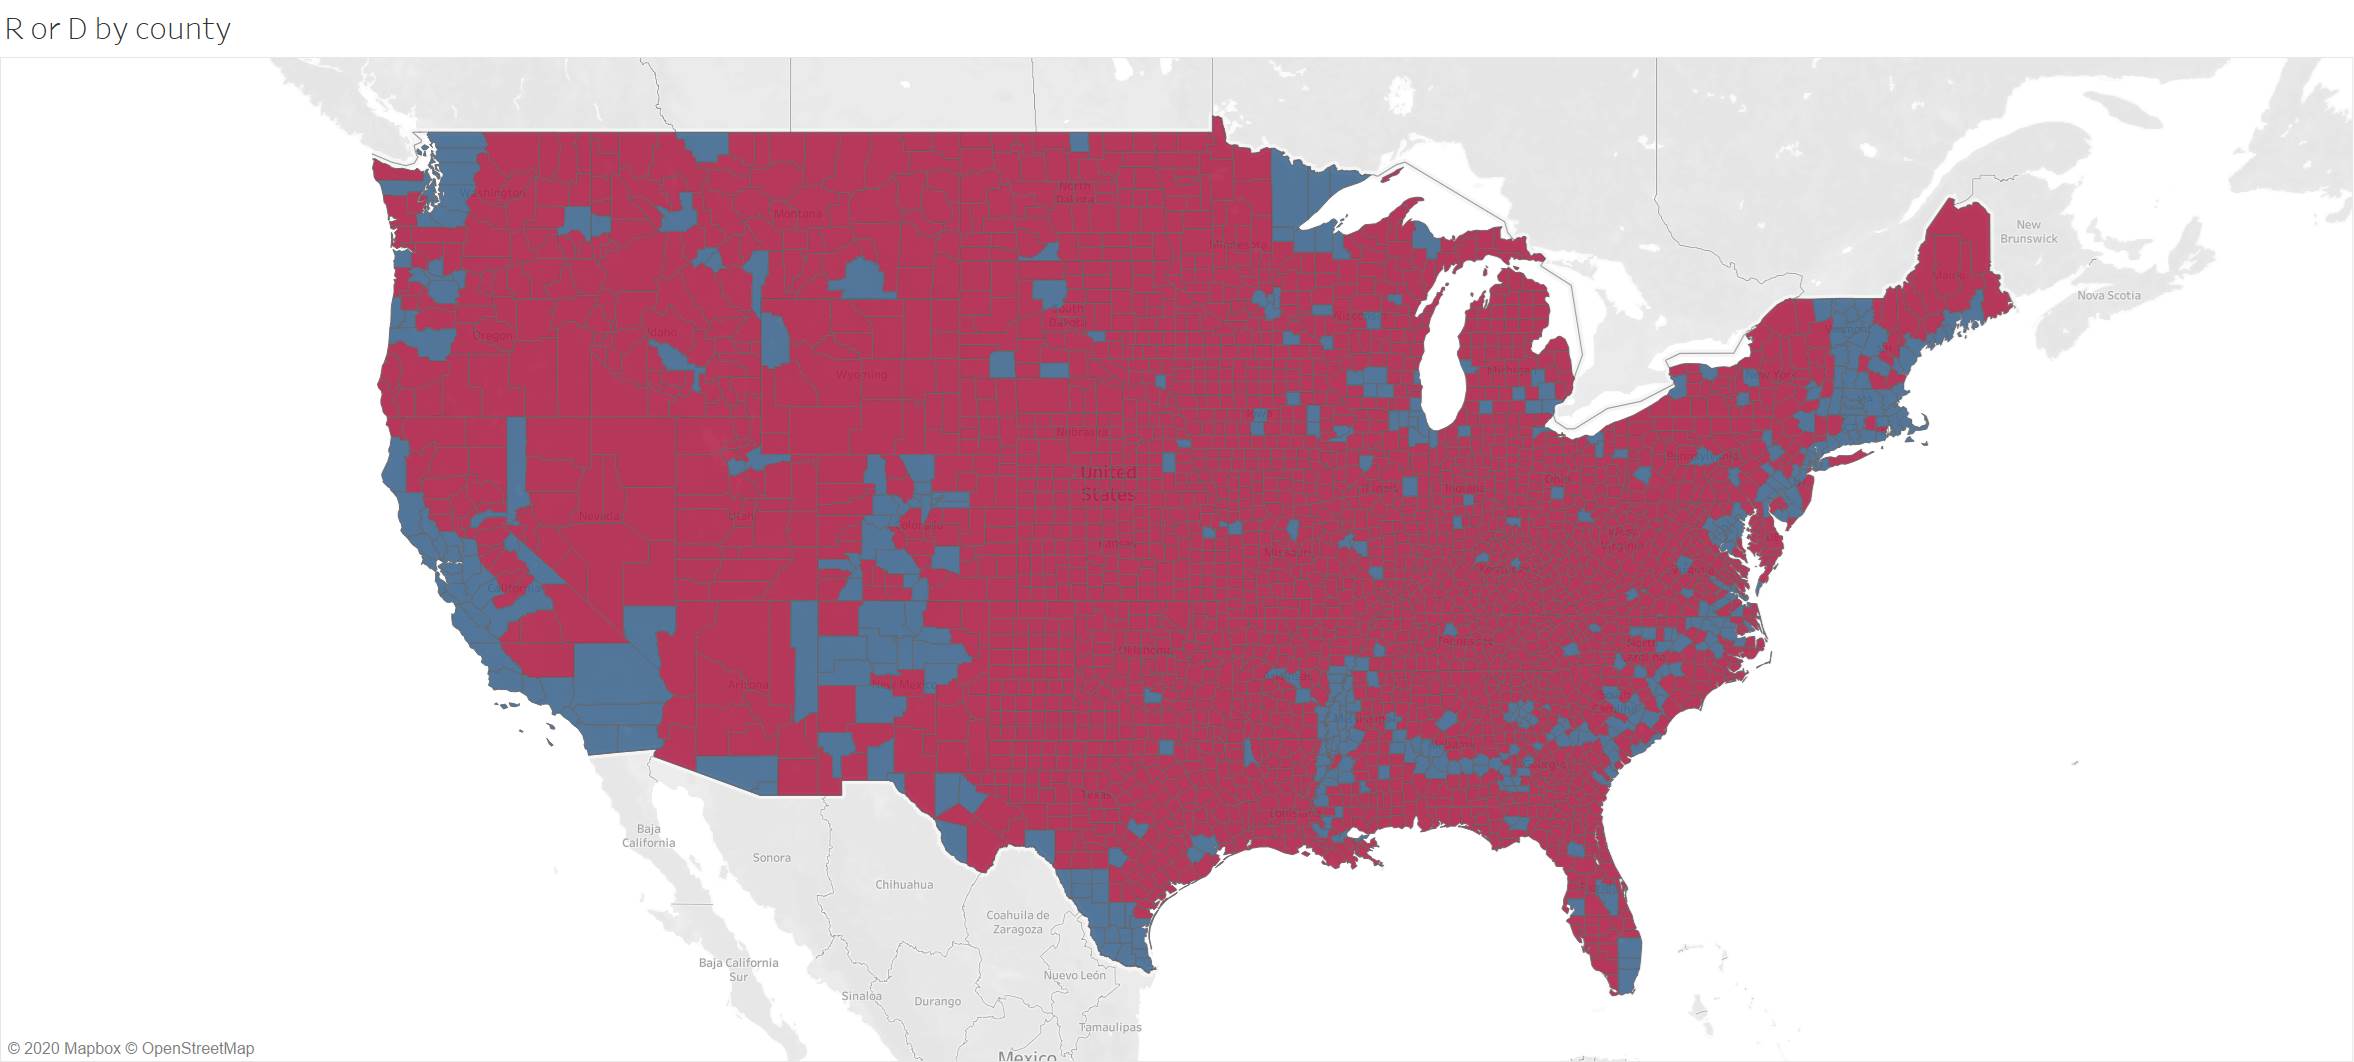
Today is a day on how data can take you somewhere you were not looking at – Looking at school activity almost looks like political map…Republican counties typically have in-school.
In school percent %
Below is IF the county % vote was greater for republican red and for democrat blue in 2016 election
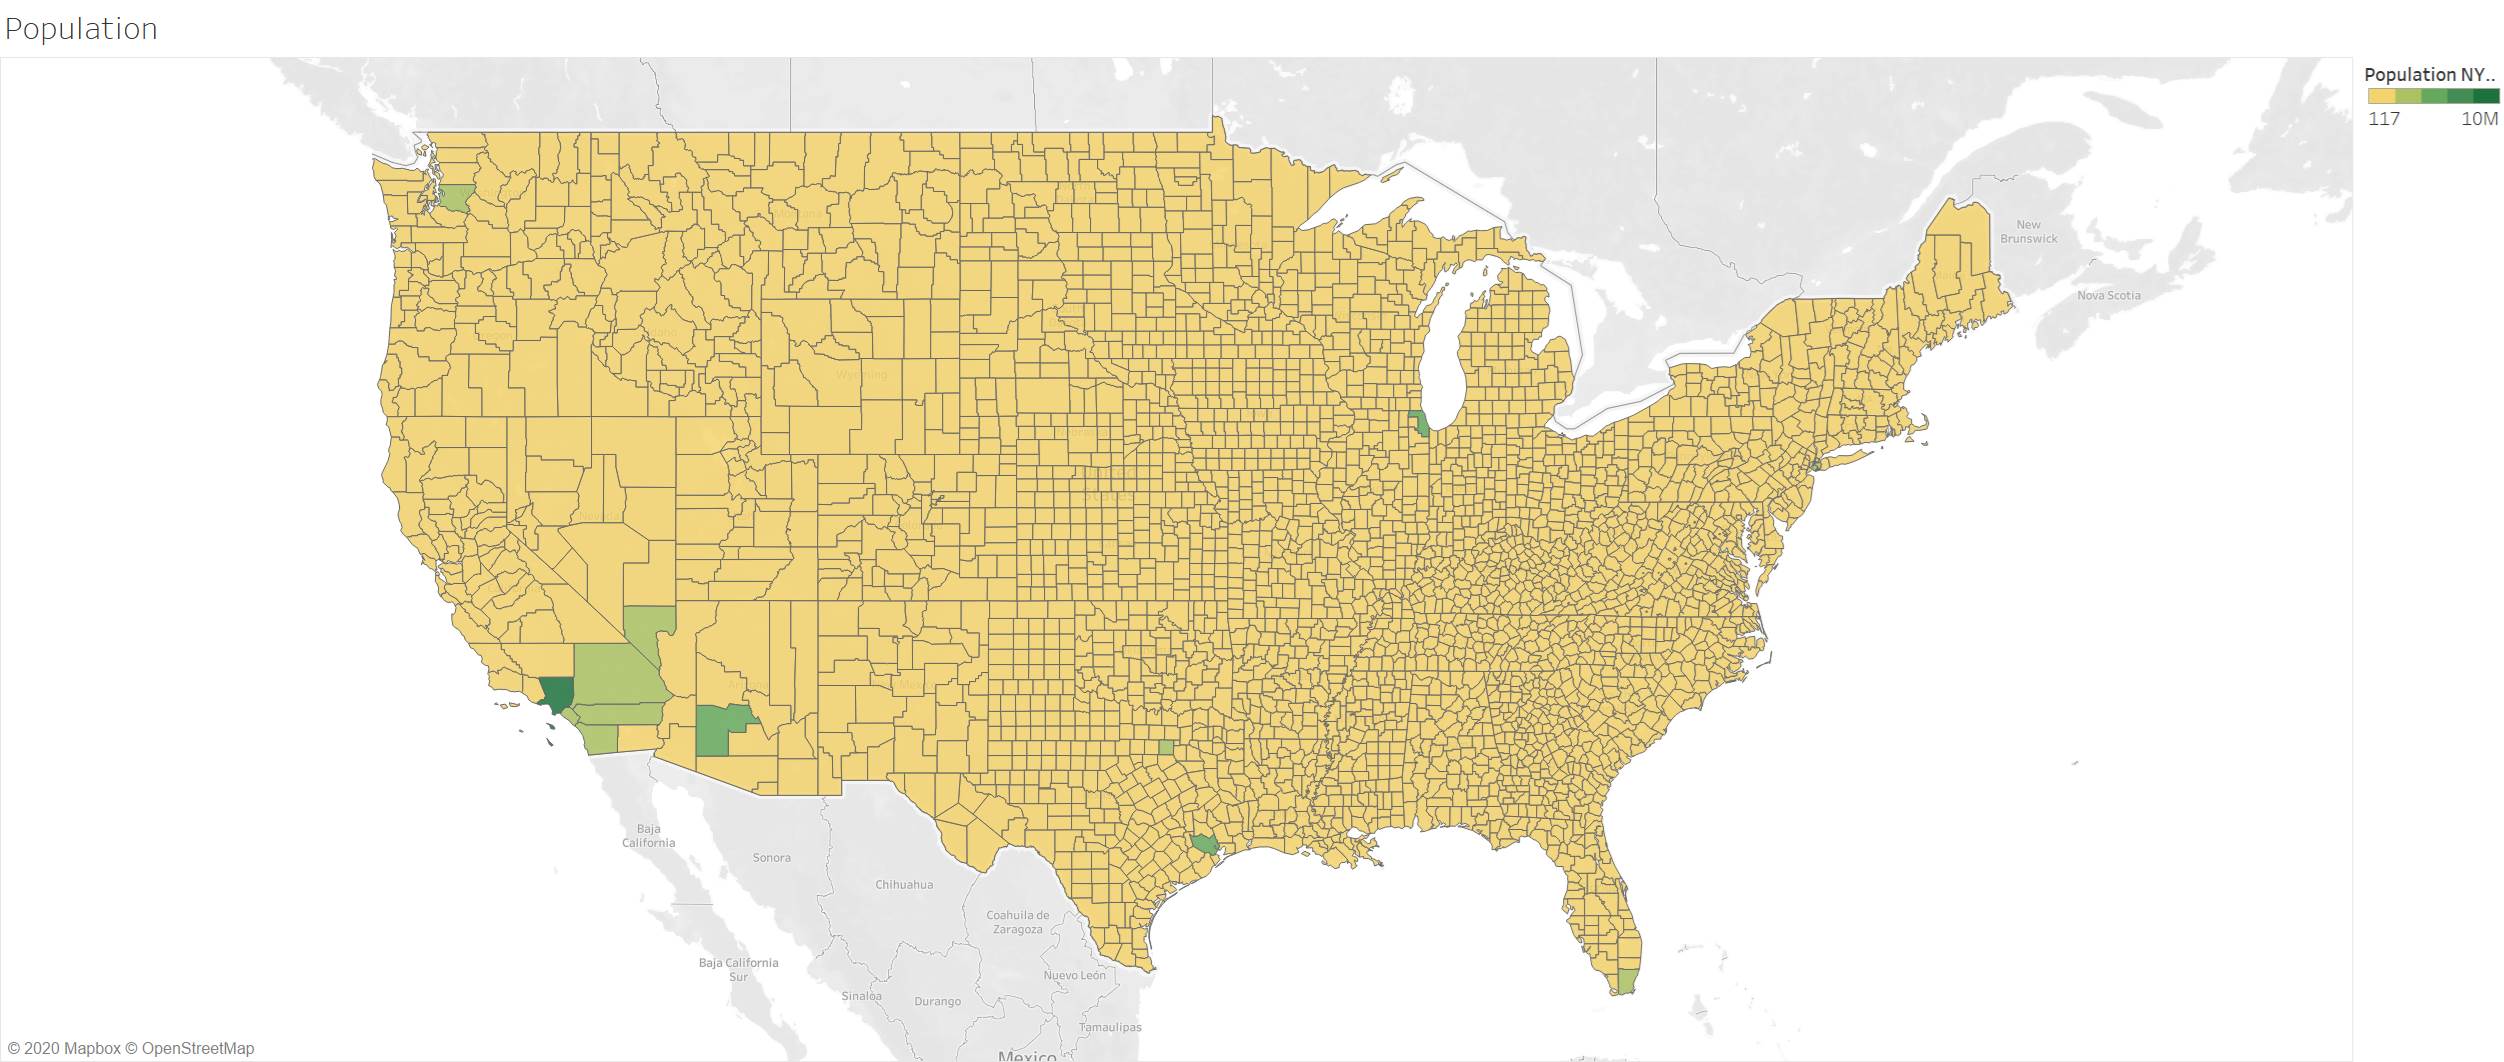
Amazing to see the geographical spacing….now look at population map and one can see the hold the democrats have on the populous.
IF you could apply the percentage of those that voted to ALL the population in the counties you would have an overwhelming population support for the democrats. (Obviously under 18 don’t vote and also over 50% don’t physically vote historically). Notice how many more counties the republicans have over the democrats.
But alas it is not a popularity contest – per the electoral college system. The land owners have an over weighted say – for better of for worse this is the system for all these years.
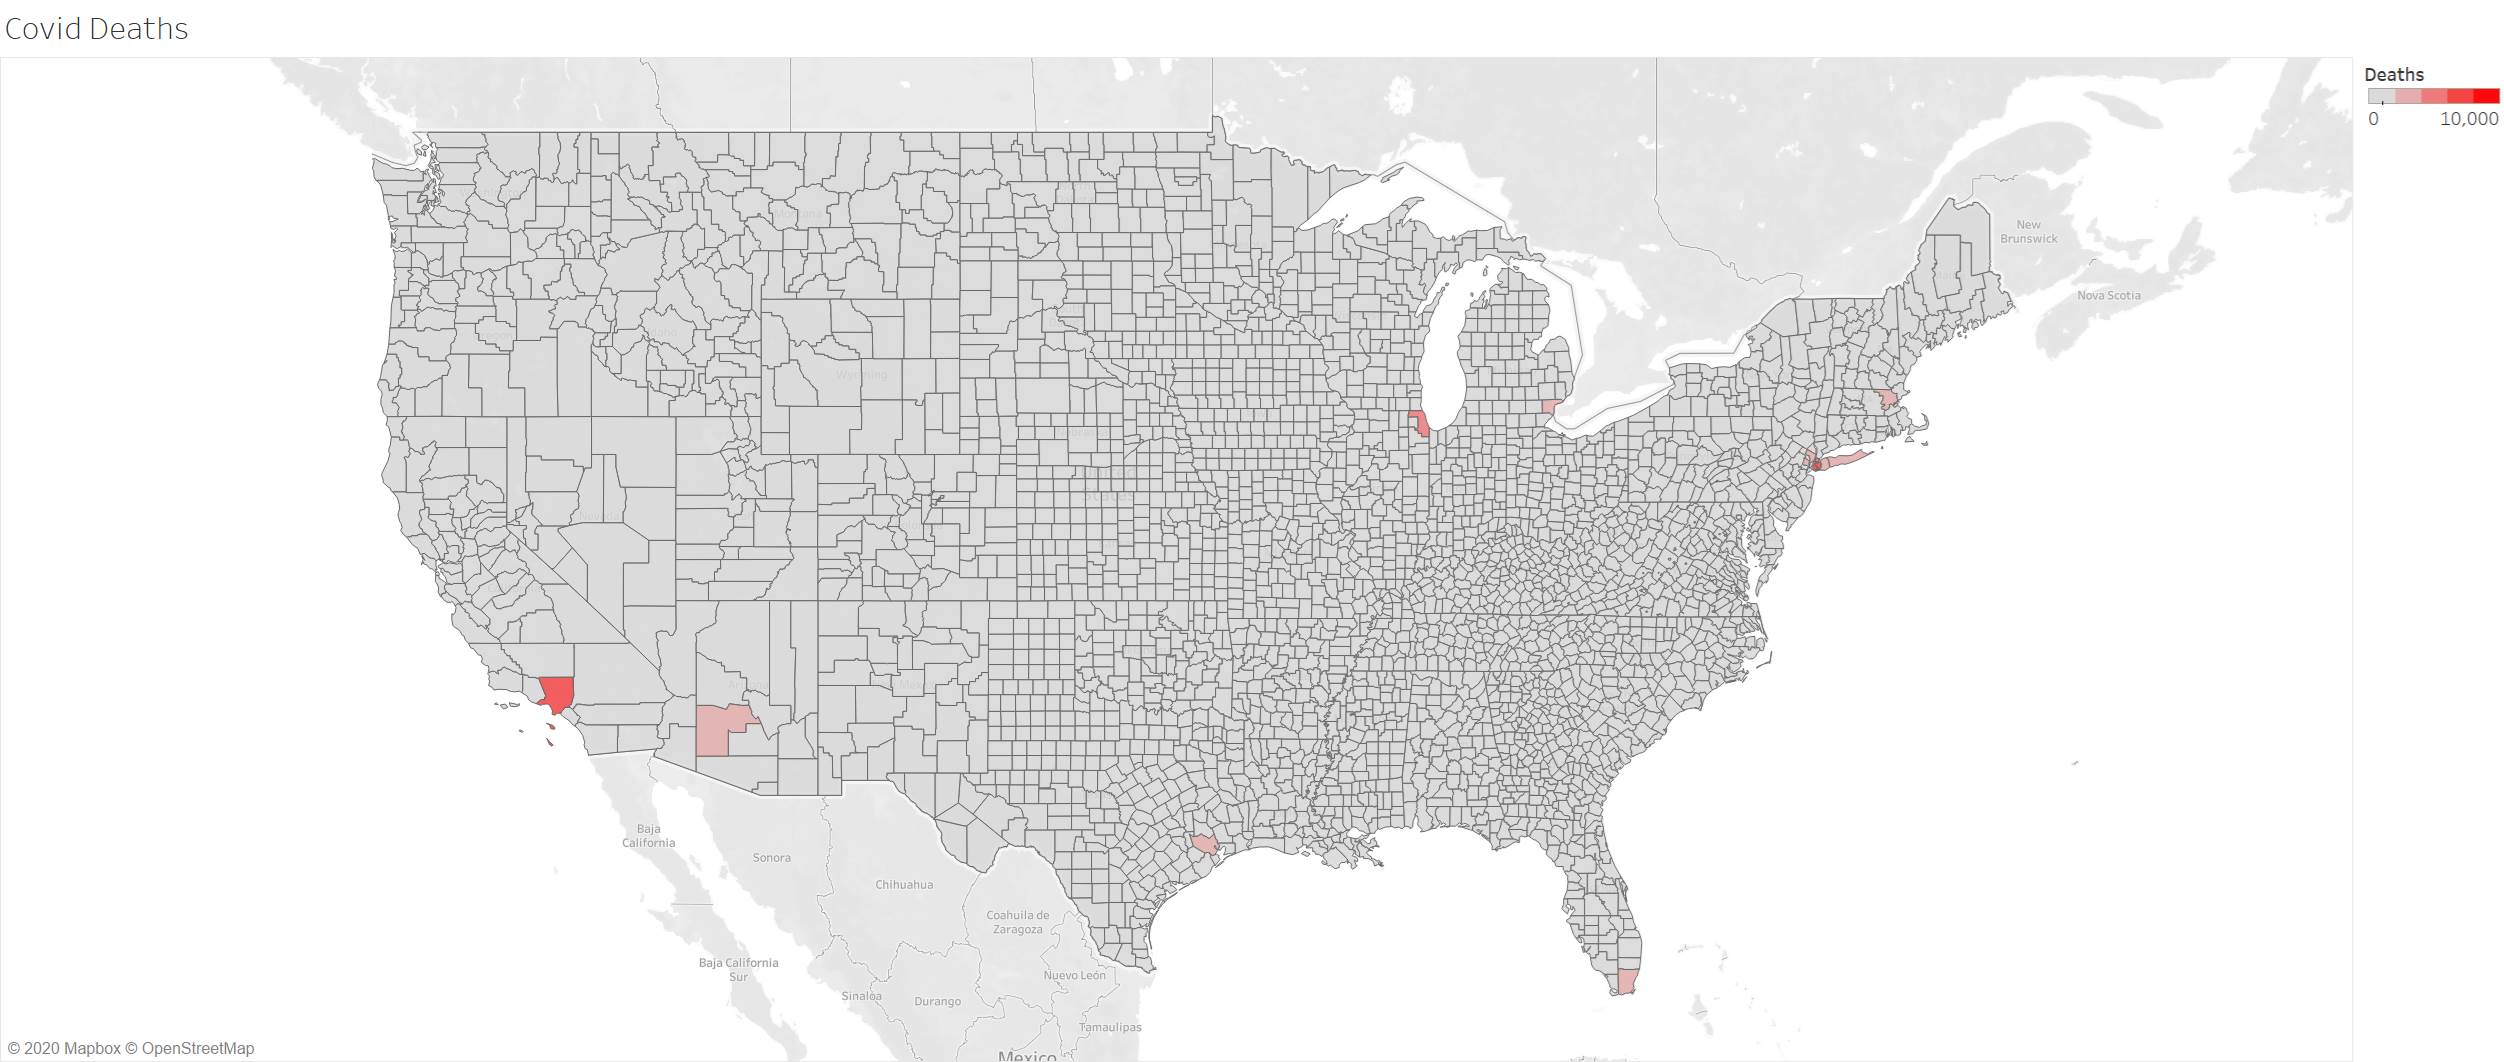
Bringing it back to covid – the deaths are very centered – somewhat intuitive in major counties with large population. Would/should the rural counties care to lock down or even be much concern about covid?
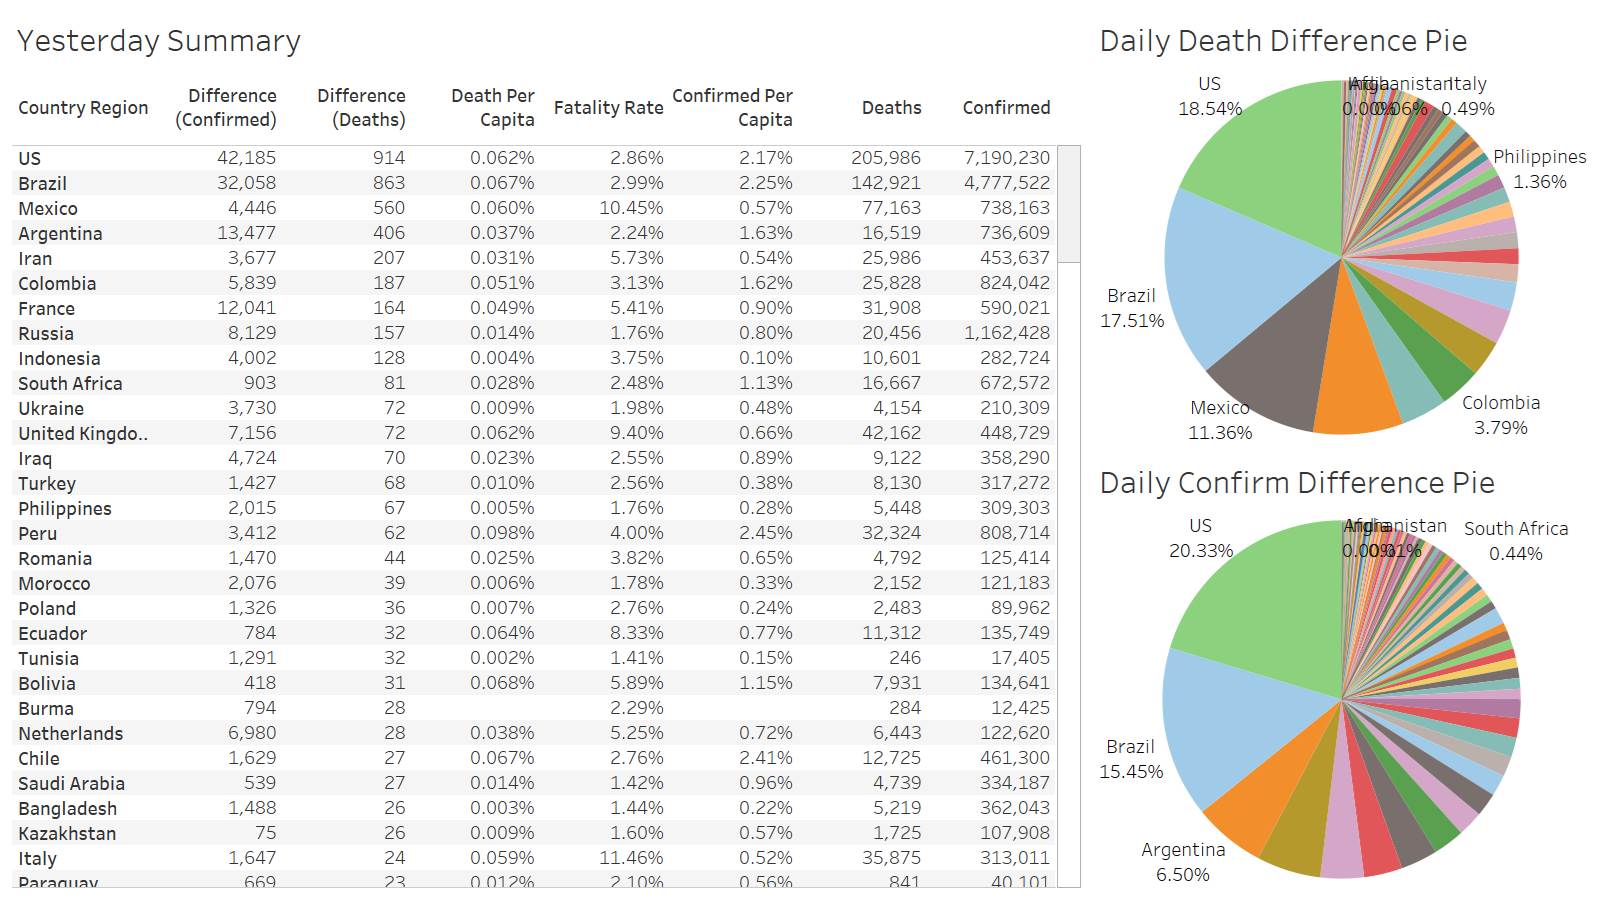
US deaths continue below 1K – India data seems sporadic.
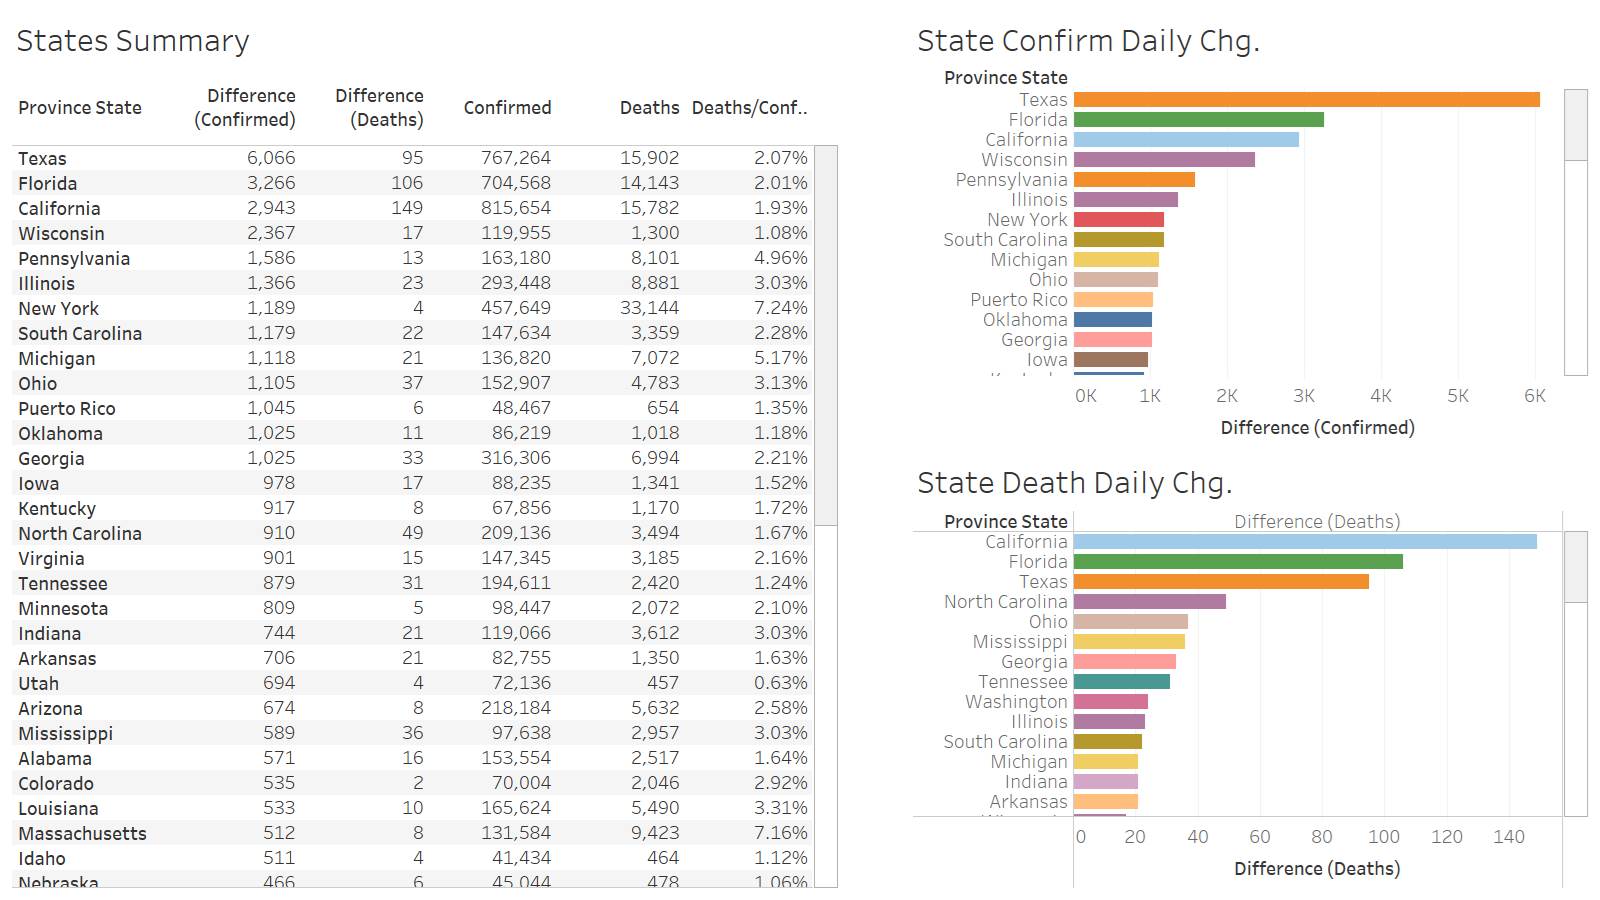
CA leads with 149
LA County leads at 36 deaths
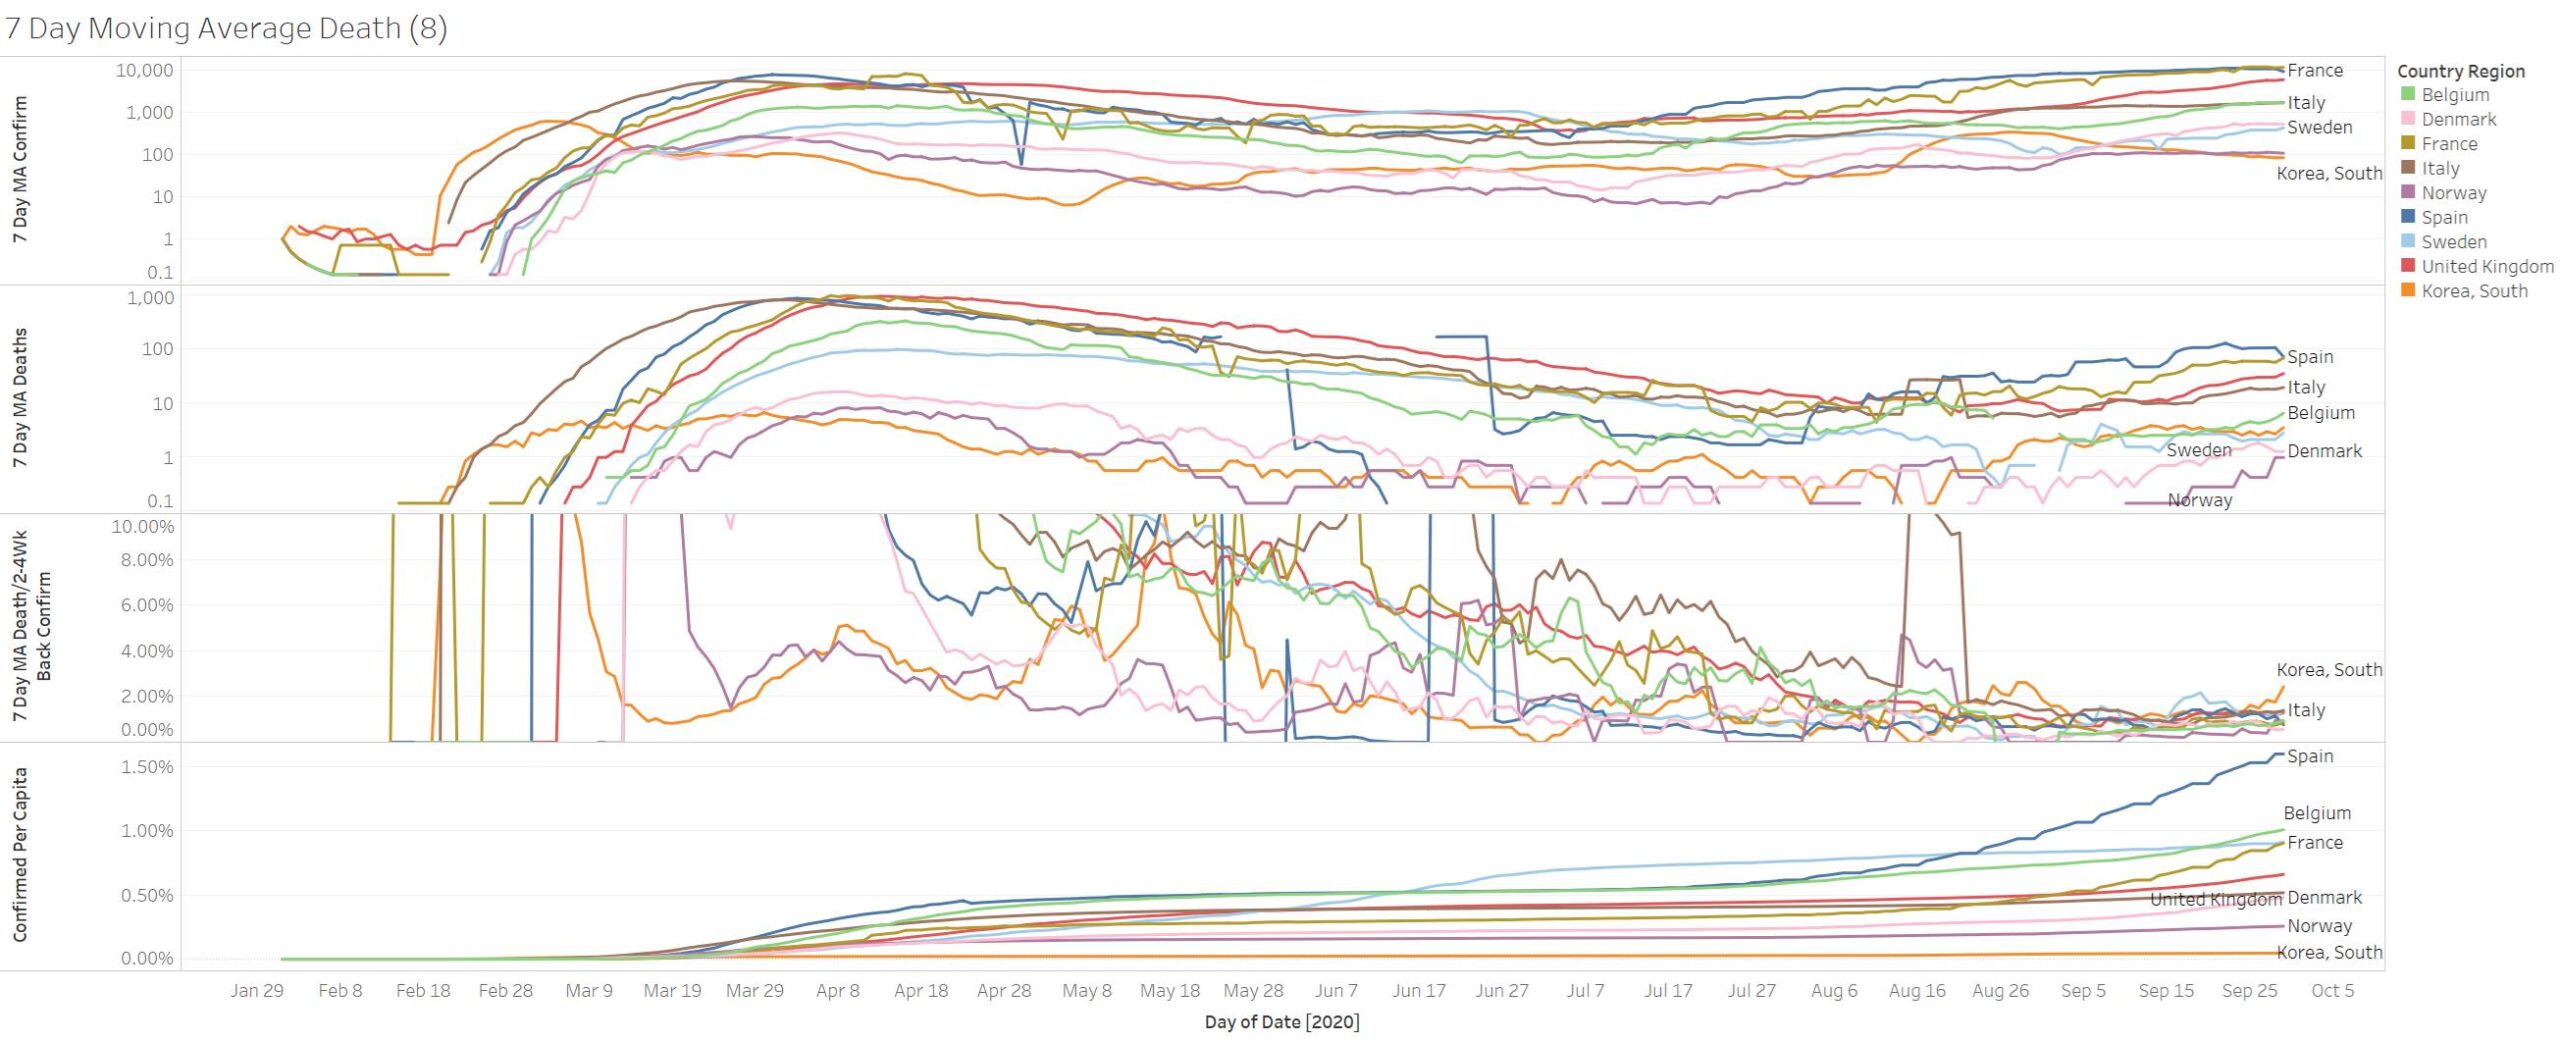
Drop in deaths in Spain is a good sign…unfortunately this comes with slight uptick in deaths for UK, Belgium, Denmark
