Covid19mathblog.com
Comparing death distribution needs to be done at known country not on global scale as other factors from healthcare access to quality of care becomes a big part of the equation. Below is just for the US. Source https://covid.cdc.gov/covid-data-tracker/#demographics and https://www.cdc.gov/flu/about/burden/2018-2019.html
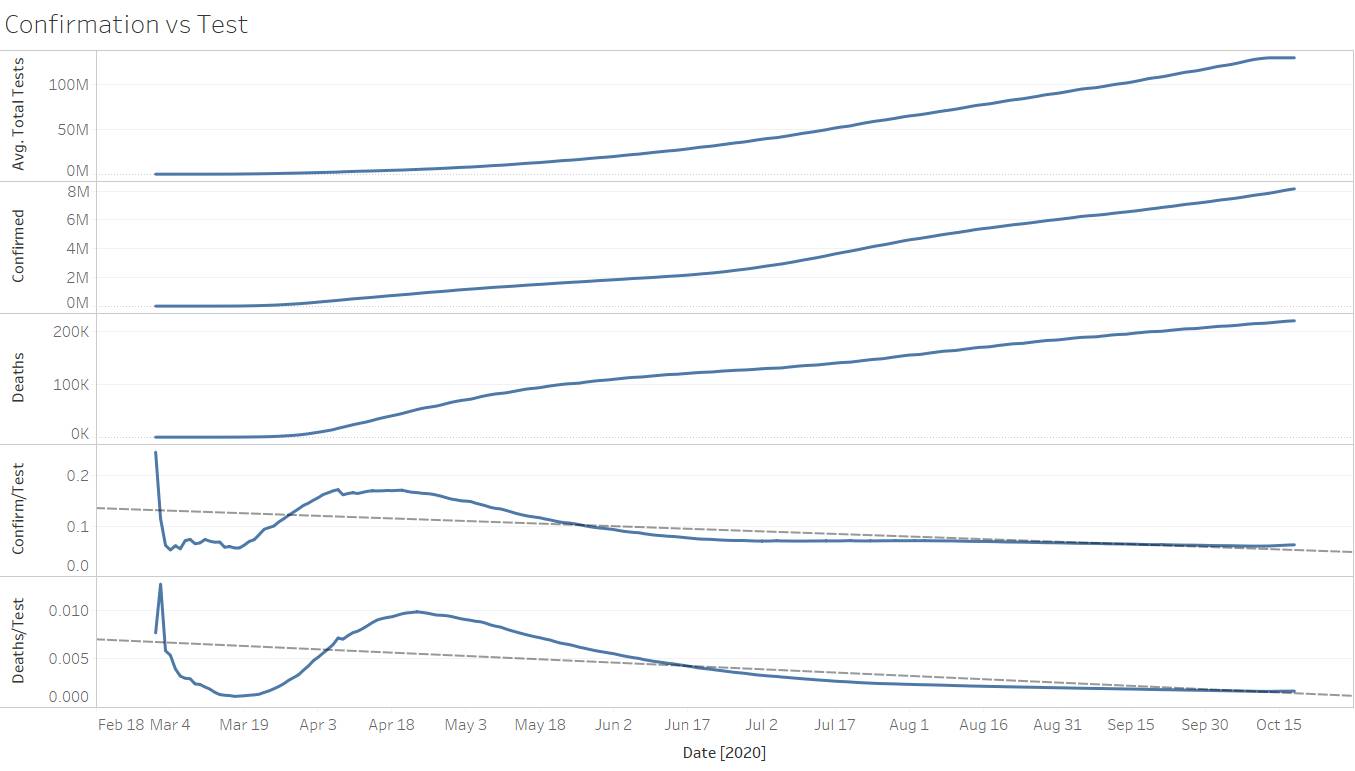
The other thing to understand is the metrics used and the realization we don’t know we can only infer during the crisis. Perhaps afterwards through more statistical sampling we can eventually calculate a fatality rate (death/confirmation). Both are growing in time and confirmations are very uncertain given asymptomatic carrier so what you will see is infection fatality ratio (IFR). This is the estimated one where they try to guesstimate how many are infected (denominator) but remember only recently have they even concluded it is airborne so how would they really understand how many are infected. Given the massive testing going on in the US we are seeing significant confirmations but relative low deaths as we are testing beyond those that are severely sick. Currently 8 million confirmed with 129 million test – so far the curve has been very flat for quite sometime. I would presume these test INCLUDE potential asymptomatic carriers?
Then when we do compare it to the flu – the flu mortality rate at least by the CDC is only focused on symptomatic illness – https://www.cdc.gov/flu/about/burden/2018-2019.html
I presume asymptomatic flu is possible?
Certainly can be very confusing so ultimately most historians like to refer to the death per population as records and questions of confirmed are not part of the equation.
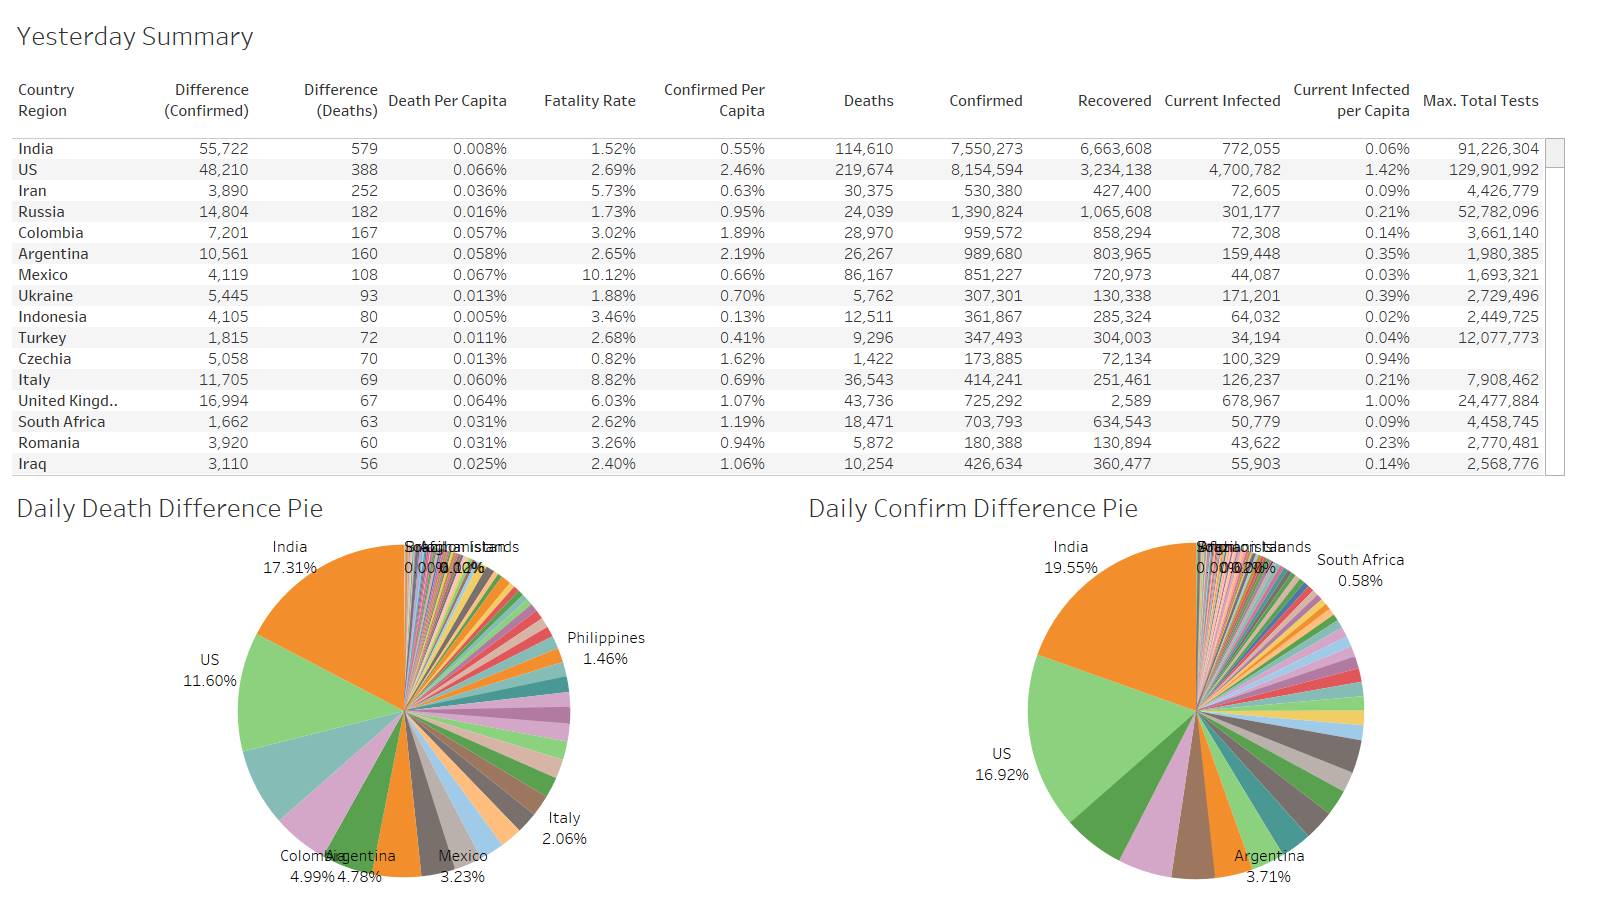
Very low reporting with US at only 388 deaths
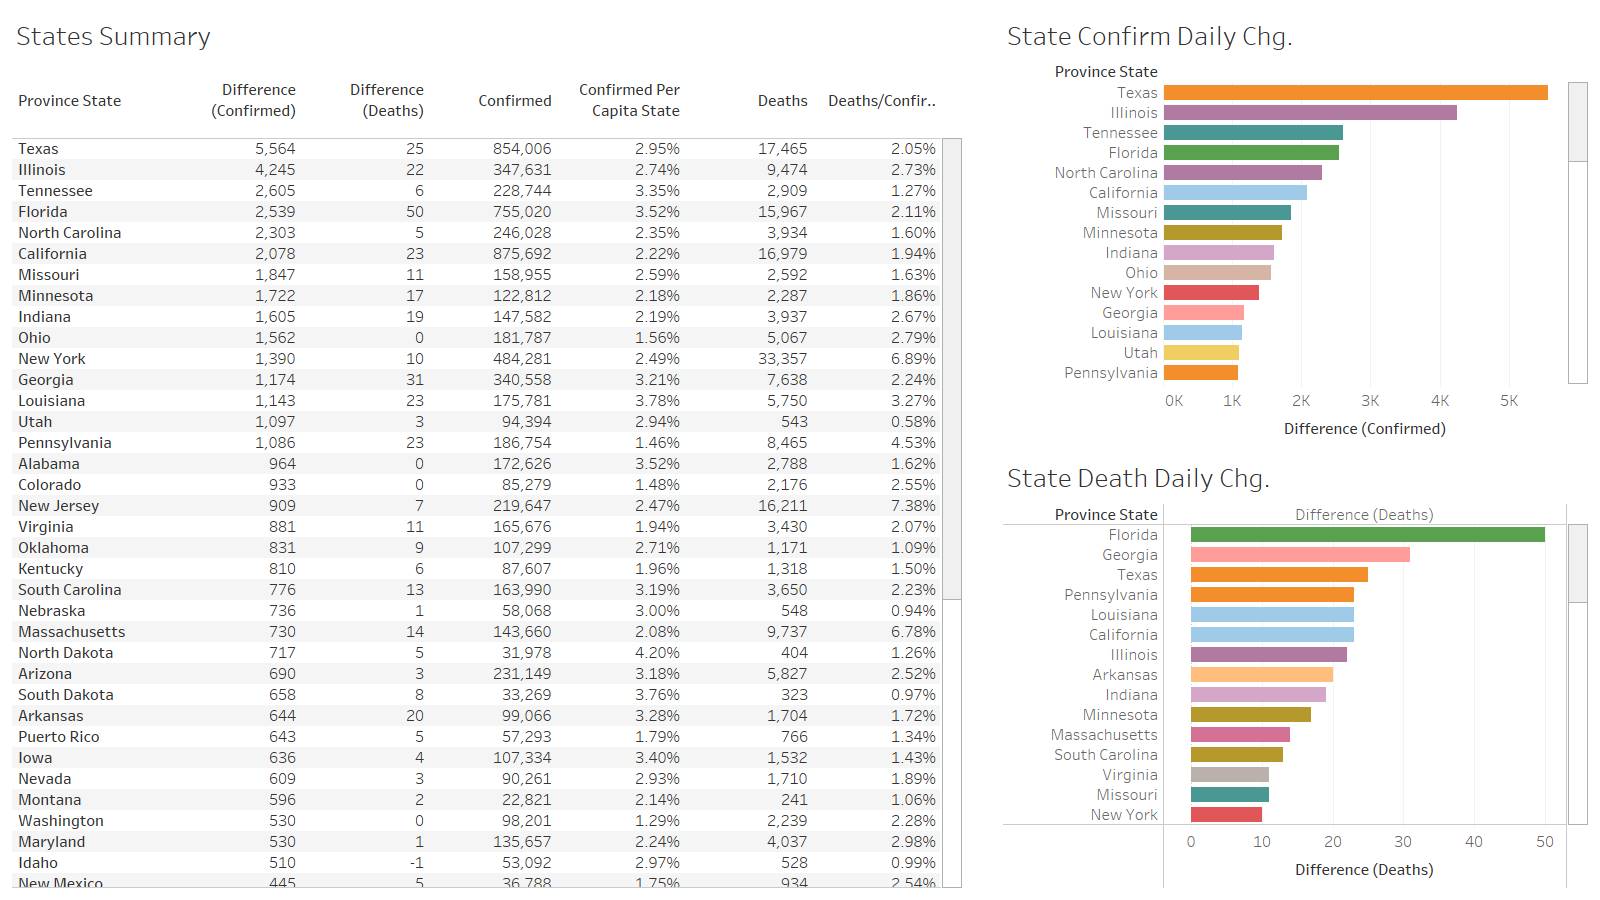
FL leads at 50
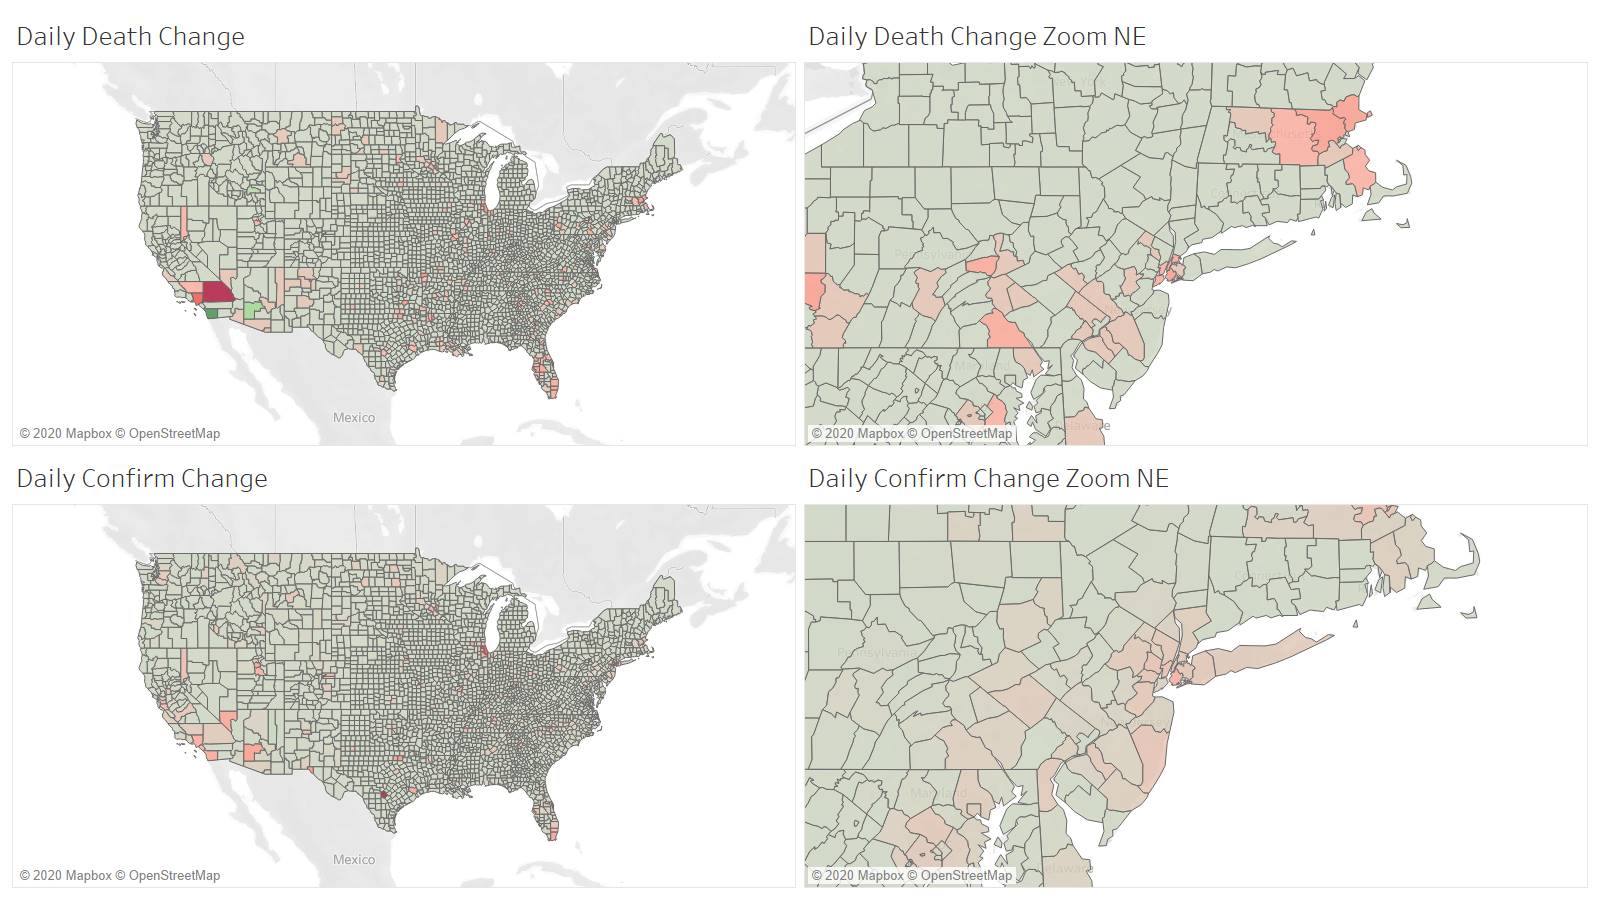
Leading US county San Bernandino CA at 23
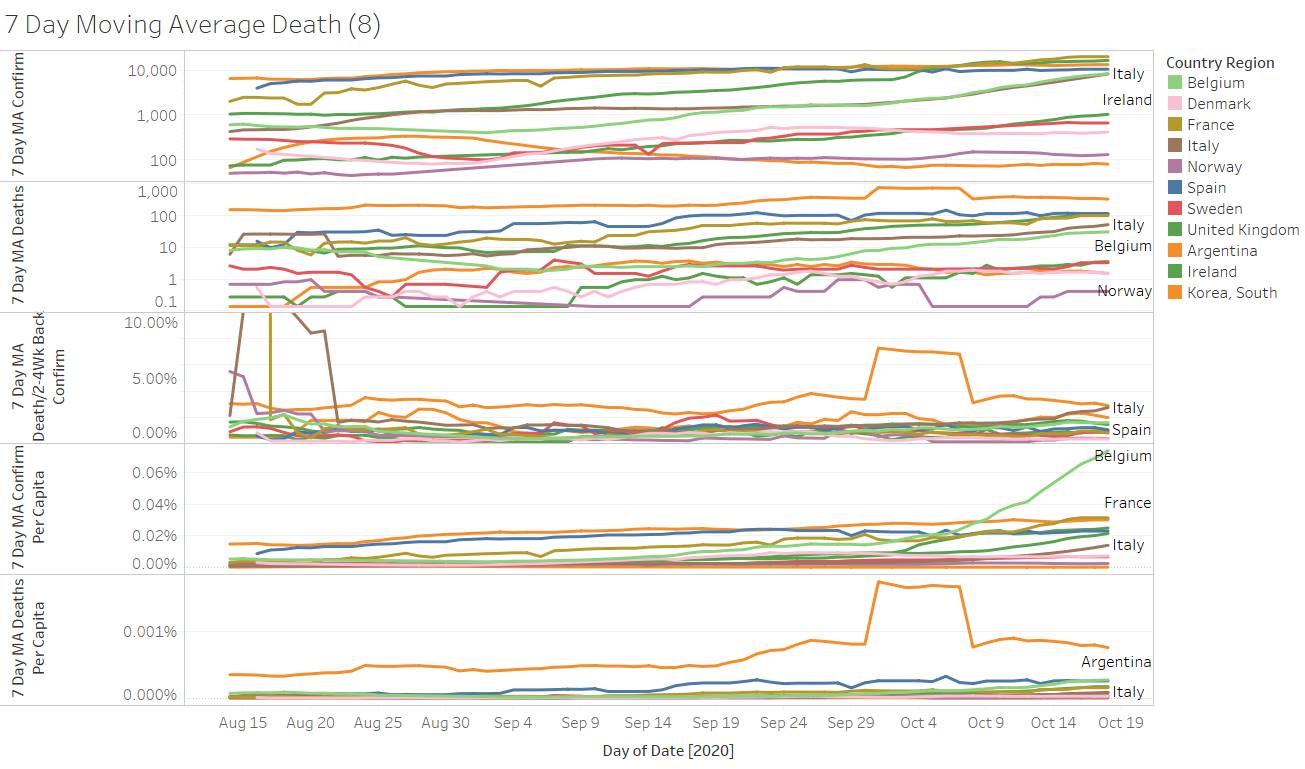
No major change in Europe

