Covid19mathblog.com
The CDC has now caught up to the obvious – even cloth mask help – https://www.cdc.gov/coronavirus/2019-ncov/more/masking-science-sars-cov2.html
“Cloth masks not only effectively block most large droplets (i.e., 20-30 microns and larger)9 but they can also block the exhalation of fine droplets and particles (also often referred to as aerosols) smaller than 10 microns ;3,5 which increase in number with the volume of speech10-12 and specific types of phonation.13 Multi-layer cloth masks can both block up to 50-70% of these fine droplets and particles3,14 and limit the forward spread of those that are not captured.5,6,15,16 Upwards of 80% blockage has been achieved in human experiments that have measured blocking of all respiratory droplets,4 with cloth masks in some studies performing on par with surgical masks as barriers for source control.”
The also list several studies proving the above statements – all quite obvious.
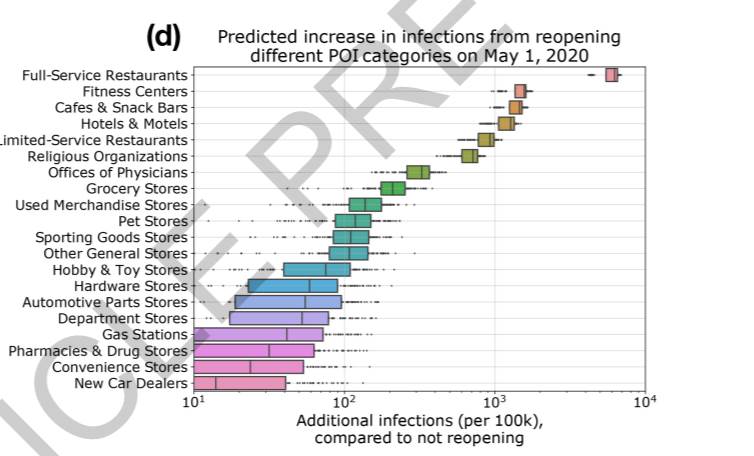
Findings on where spreading is coming from – this study notes restaurants, gyms, hotels, and houses are among 10% of locations but account for 85% of the infection! They also conclude that lower income – though they say disadvantaged racial – without proving it was social economics vs race – https://www.nature.com/articles/s41586-020-2923-3
“Derived from cell phone data, our
mobility networks map the hourly movements of 98 million people from
neighborhoods (census block groups, or CBGs) to points of interest (POIs) such as
restaurants and religious establishments, connecting 57k CBGs to 553k POIs with 5.4
billion hourly edges. We show that by integrating these networks, a relatively simple
SEIR model can accurately ft the real case trajectory, despite substantial changes in
population behavior over time. Our model predicts that a small minority of
“superspreader” POIs account for a large majority of infections and that restricting
maximum occupancy at each POI is more efective than uniformly reducing mobility.”
“10% of POIs accounted for 85% (95% CI, 83%–87%) of the predicted infections at POIs”
“Certain categories of POIs also contributed far more to infections (e.g., full-service restaurants, hotels),”
“lower-income CBGs in the Chicago
metro area had 27% more POI visits per capita than higher-income
CBGs. Category-level differences in visit patterns partially explained
the infection disparities within each category: e.g., lower-income CBGs
made substantially more visits per capita to grocery stores than did
higher-income CBGs (Figure S3), and consequently experienced more
predicted infections at that category (Figure S2)”
“POIs frequented by lower-income CBGs tended to
be smaller and more crowded in the mobility data”
On an economic basis it likely makes sense that lower income areas have/need higher density as margins per customer likely lower. I don’t think this is race – but socioeconomics. Scary to see full service restaurants so far out there. They should probably delve into that to see if some restaurants are better than others and what can one do to get better – e.g. increase/modify ventilation?
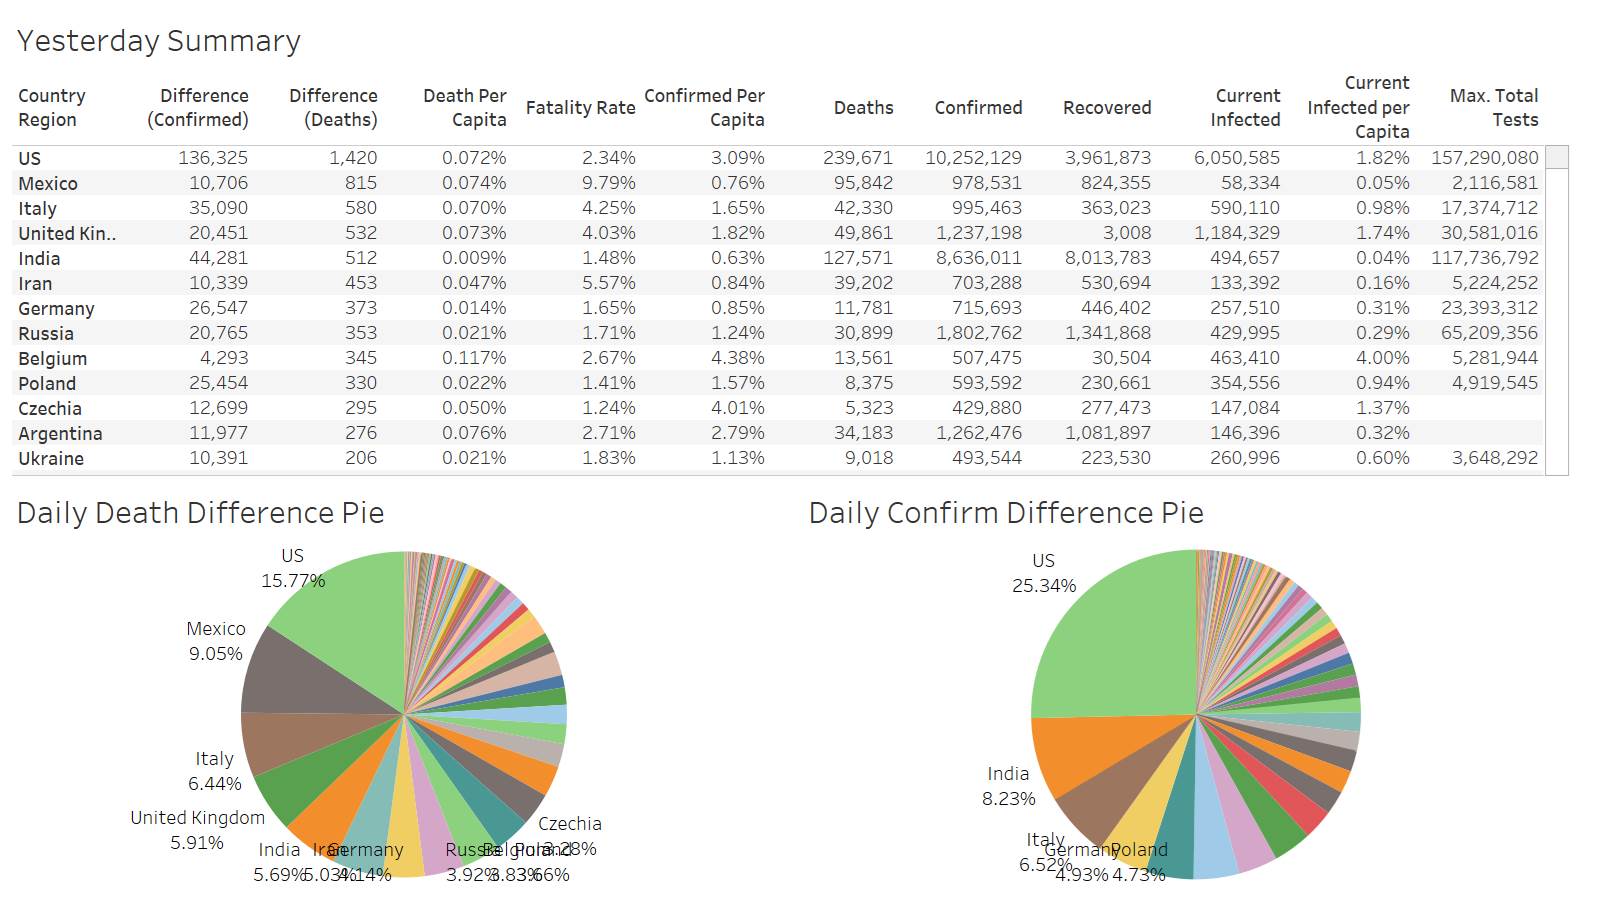
US death 1420 with confirmation 136K
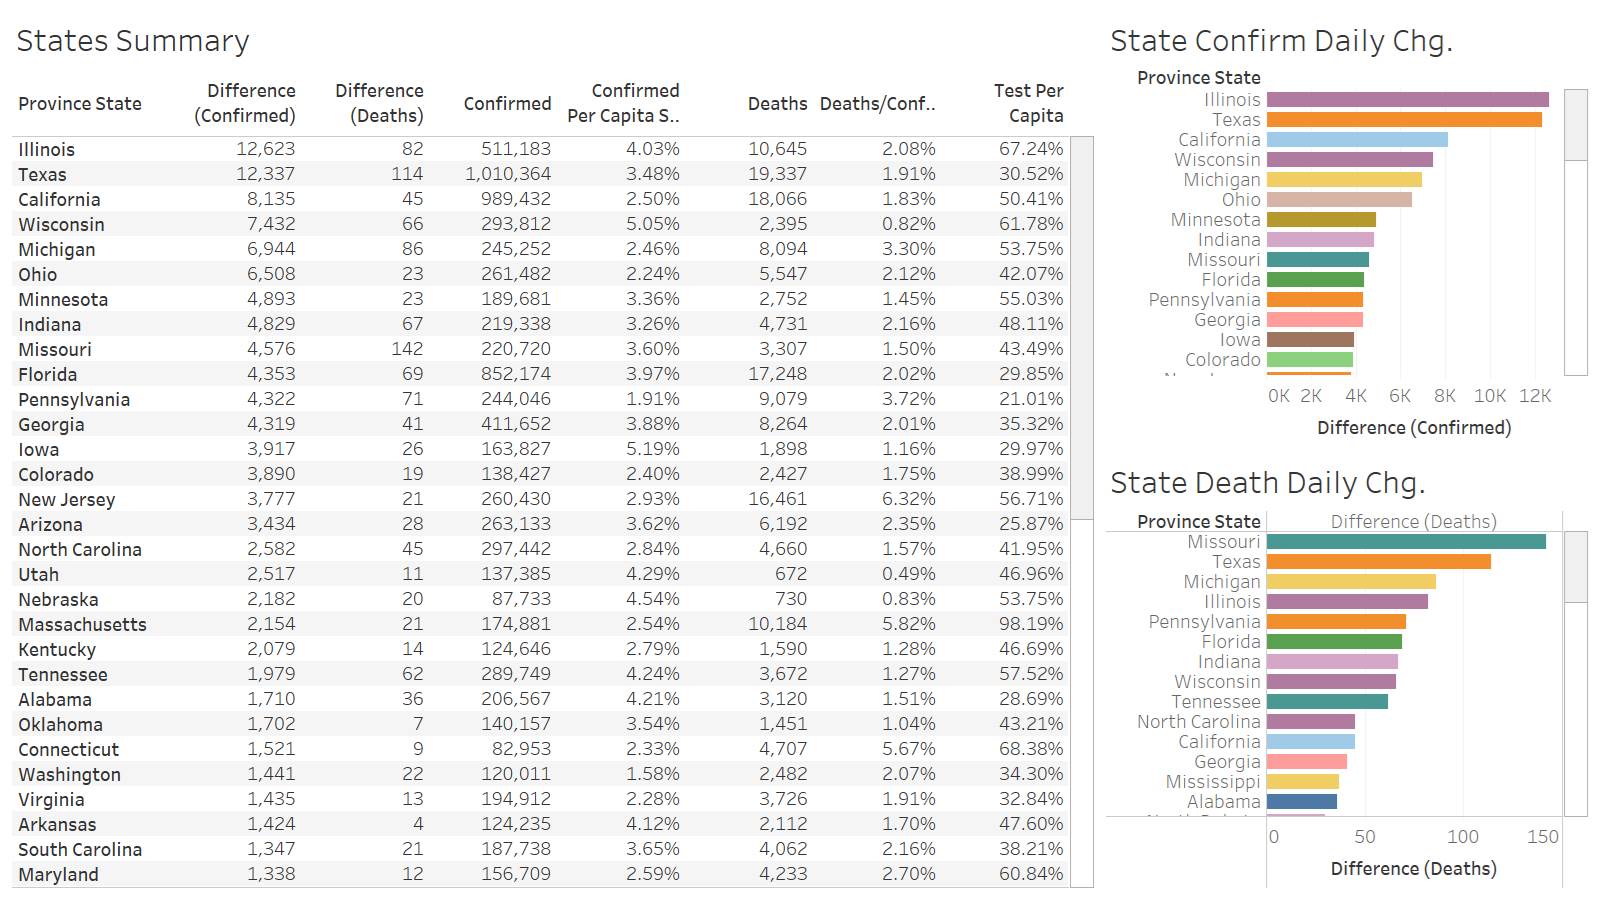
Missouri lead the US death at 142 for the first time. Both IL and TX saw confirmations 12K+
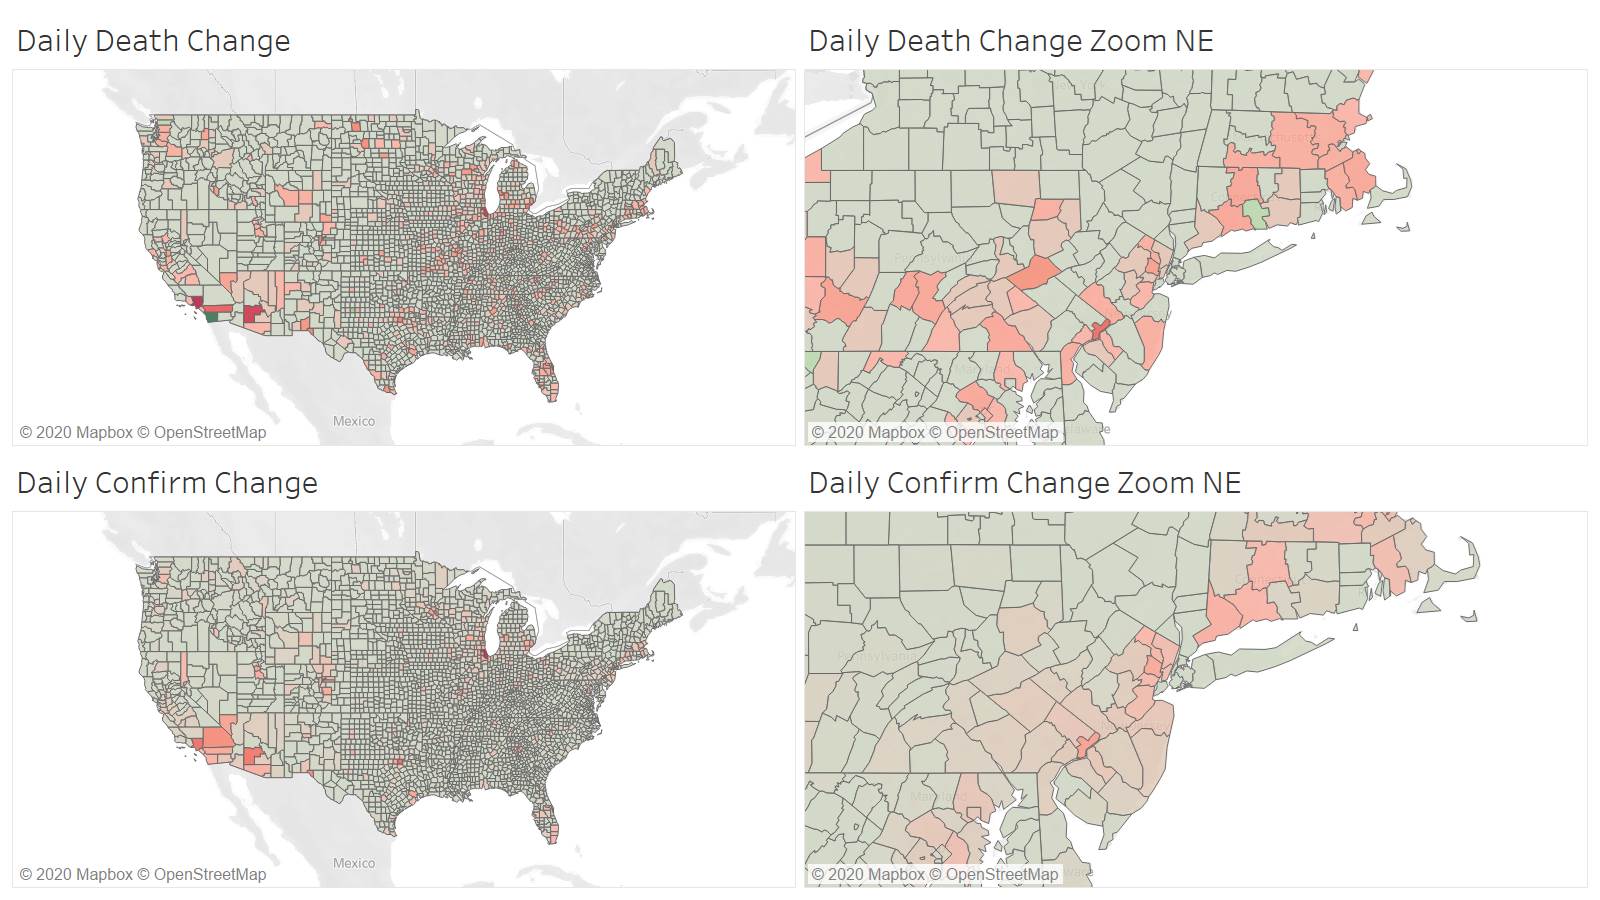
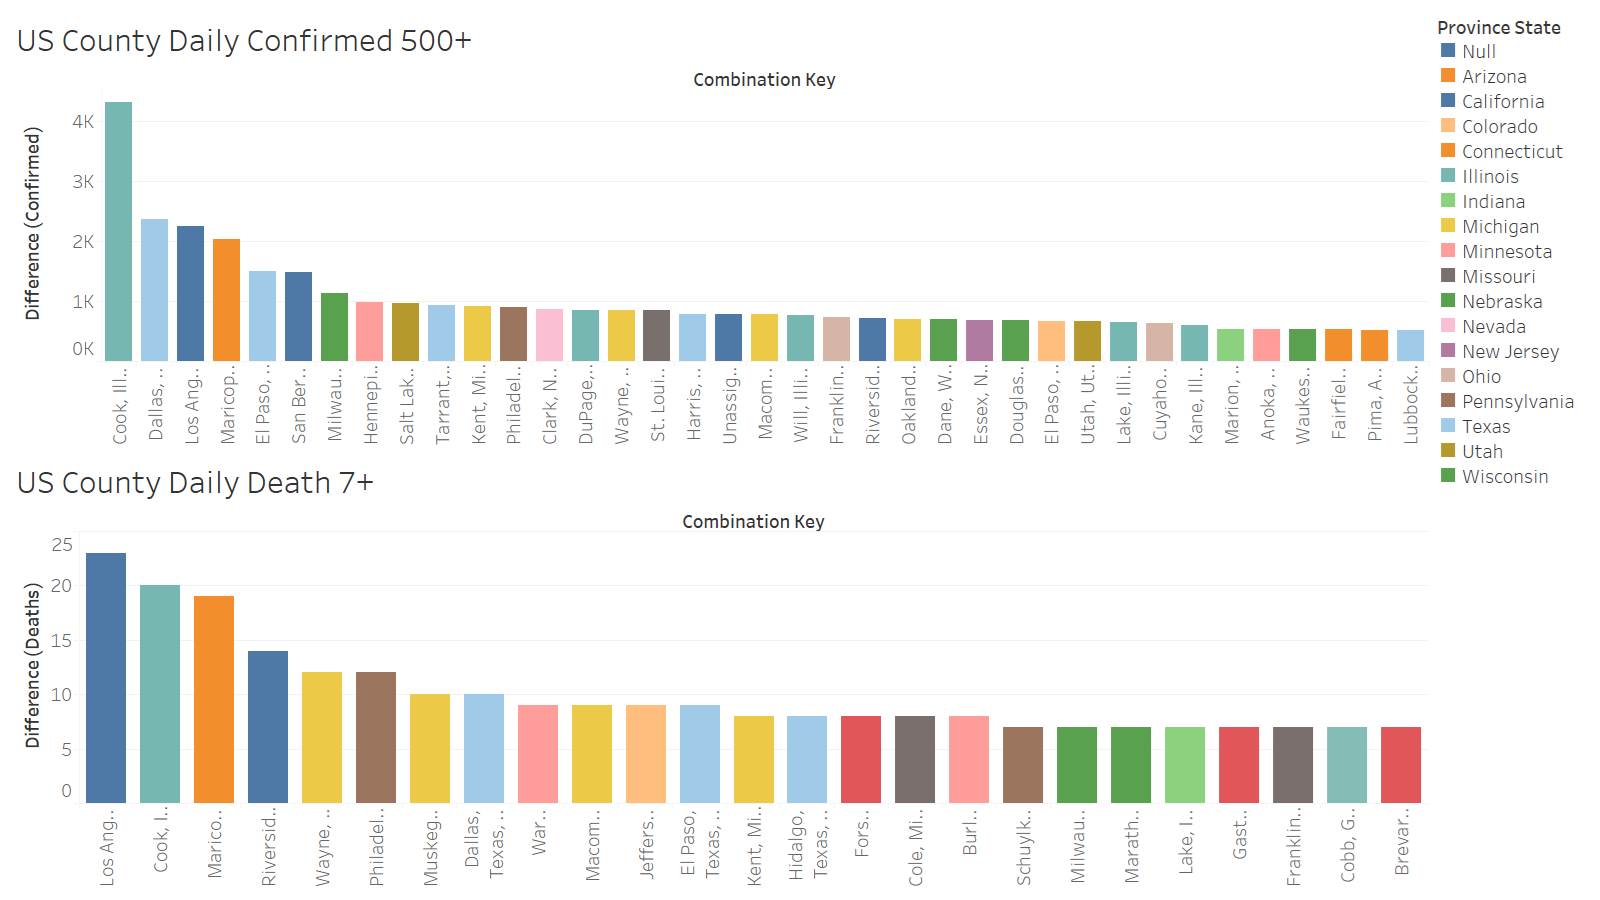
Big death reporting dispersion over the US
TX confirmation was very dispersed. LA leading in death followed by Cook and Maricopa
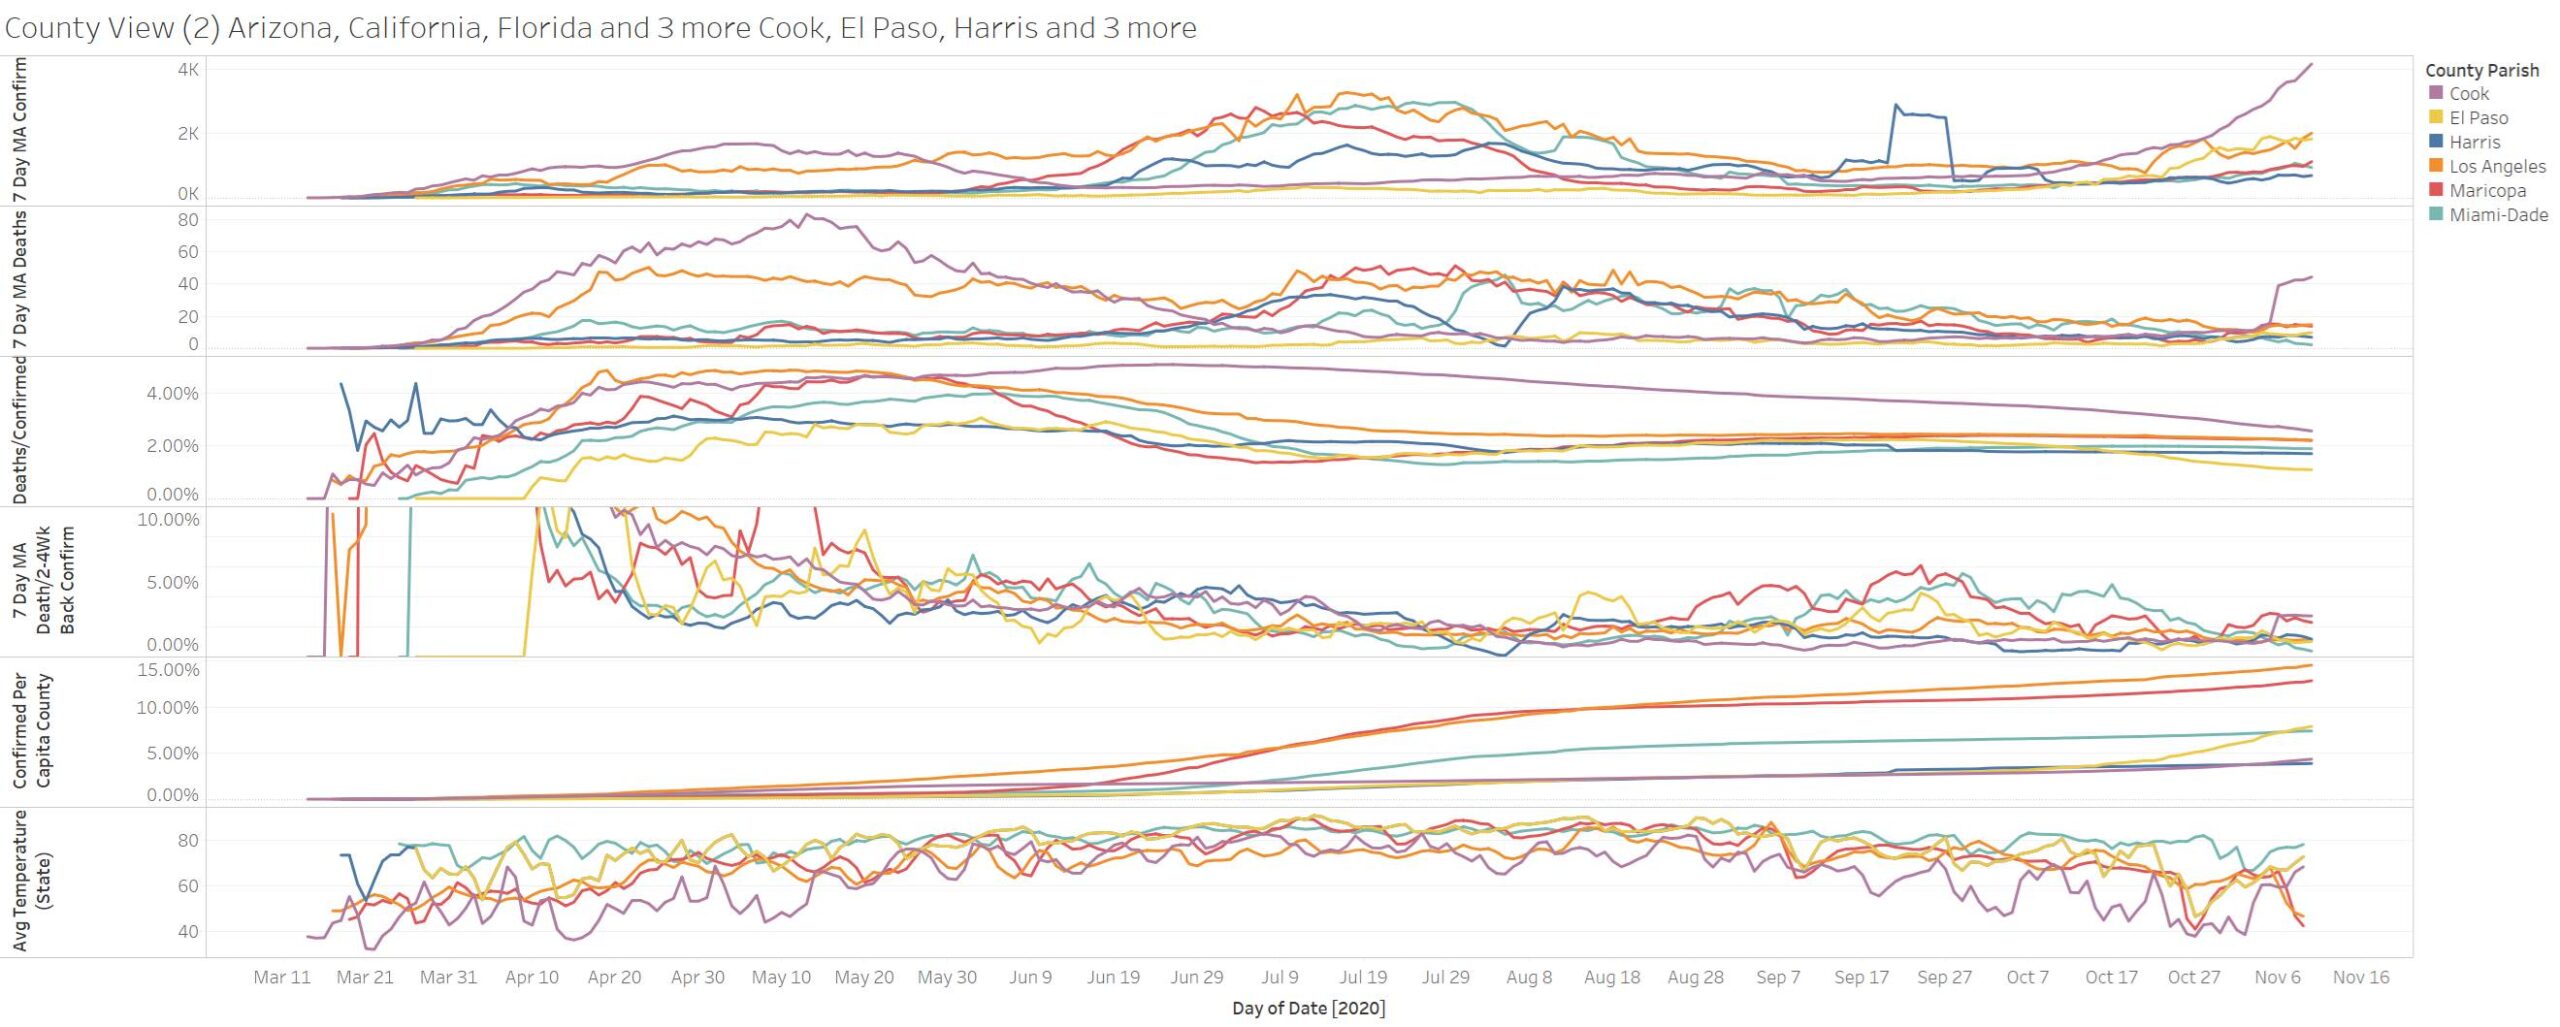
Cook IL still shows no sign of slowdown in the ramp of confirmation and death. El Paso TX shows a leveling.
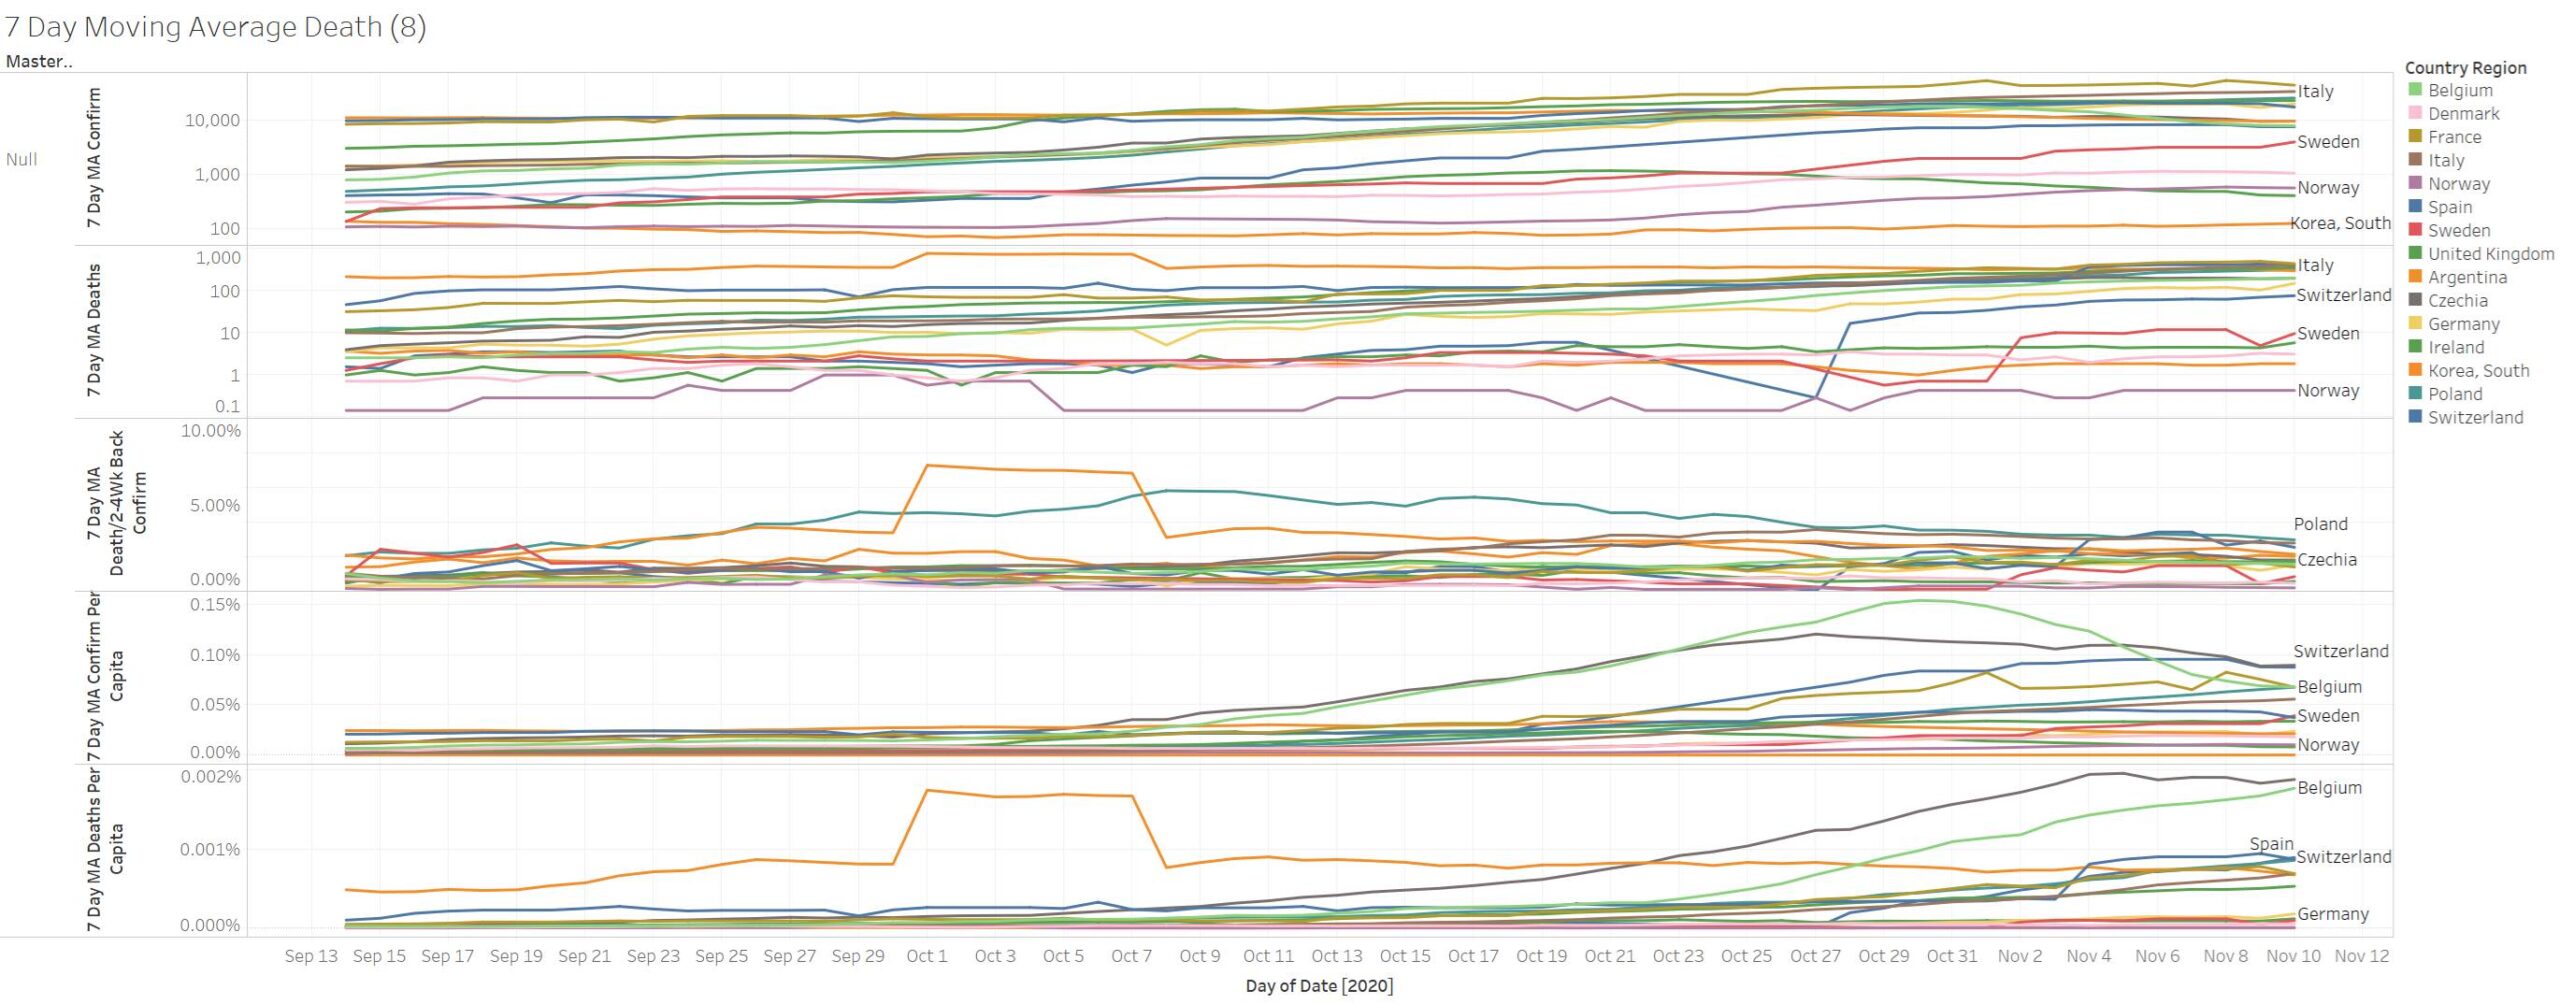
Most European countries now starting to show a leveling off of confirmations and deaths
