Covid19mathblog.com
Not the best two papers to start a new week – but they represent good food for thought.
This paper is from Stanford documenting the most restrictive non-pharmaceutical interventions (mrNPI) e.g. stay at home and business closures were not significant at reducing as compared to the less restrictive policies. https://onlinelibrary.wiley.com/doi/epdf/10.1111/eci.13484
“While small benefits cannot be excluded, we do not find significant benefits on case growth of more restrictive NPIs. Similar reductions in case growth may be achievable with less restrictive interventions”
“We first estimate COVID-19 case growth in relation to any NPI implementation in subnational regions of 10 countries: England, France, Germany, Iran, Italy, Netherlands, Spain, South Korea, Sweden, and the US”
Here is an NBER working paper documenting/projecting the deaths from collateral damage as result of covid economic impact. https://www.nber.org/system/files/working_papers/w28304/w28304.pdf
“We adopt a time series approach to investigate the historical relation between unemployment, life
expectancy, and mortality rates. We fit a Vector-autoregression (VAR) for the overall US
population and for groups identified based on gender and race. We find that shocks to
unemployment are followed by statistically significant increases in mortality rates and declines in
life expectancy. We use our results to assess the long-run effects of the COVID-19 economic
recession on mortality and life expectancy. We estimate the size of the COVID-19-related
unemployment to be between 2 and 5 times larger than the typical unemployment shock,
depending on race/gender, resulting in a 3.0% increase in mortality rate and a 0.5% drop in life
expectancy over the next 15 years for the overall American population. We also predict that the
shock will disproportionately affect African-Americans and women, over a short horizon, while
white men might suffer large consequences over longer horizons. These figures translate in a
staggering 0.89 million additional deaths over the next 15 years.”
“the COVID-19 unemployment shock is about 3.17 standard deviations larger than the typical shock to the unemployment rate for the overall population (about
2.68% in magnitude)”
“For the overall population, the increase in the death
rate following the COVID-19 pandemic implies a staggering 0.89 and 1.37 million excess deaths
over the next 15 and 20 years, respectively. These numbers correspond to 0.24% and 0.37%
of the projected US population at the 15- and 20-year horizons, respectively.”
“Without any doubt, lockdowns
save lives, but they also contribute to the decline in real activity that can have severe consequences on health. Policy-makers should therefore consider combining lockdowns with policy
interventions meant to reduce economic distress, guarantee access to health care, and facilitate
effective economic reopening under health care policies to limit SARS-CoV-19 spread”
“there are several reasons explaining why unemployment could have contemporaneous
effects on mortality rates (not commuting to work, no risk of work related deaths, etc.). The
finding that an unemployment shock is eventually followed by an increase in mortality and a
decline in life-expectancy is robust to using this different identification strategy. However, when
using this alternative identification assumption, an interesting result emerges with respect to
the short-run dynamics. An increase in unemployment leads to a contemporaneous decline in
mortality rates and to a contemporaneous increase in life-expectancy. This effect quickly reverts in two-three years and in the long-run mortality increases and life expectancy declines, in
line with our benchmark results. In other words, the long-term effect dominates the short-term
dynamics.”
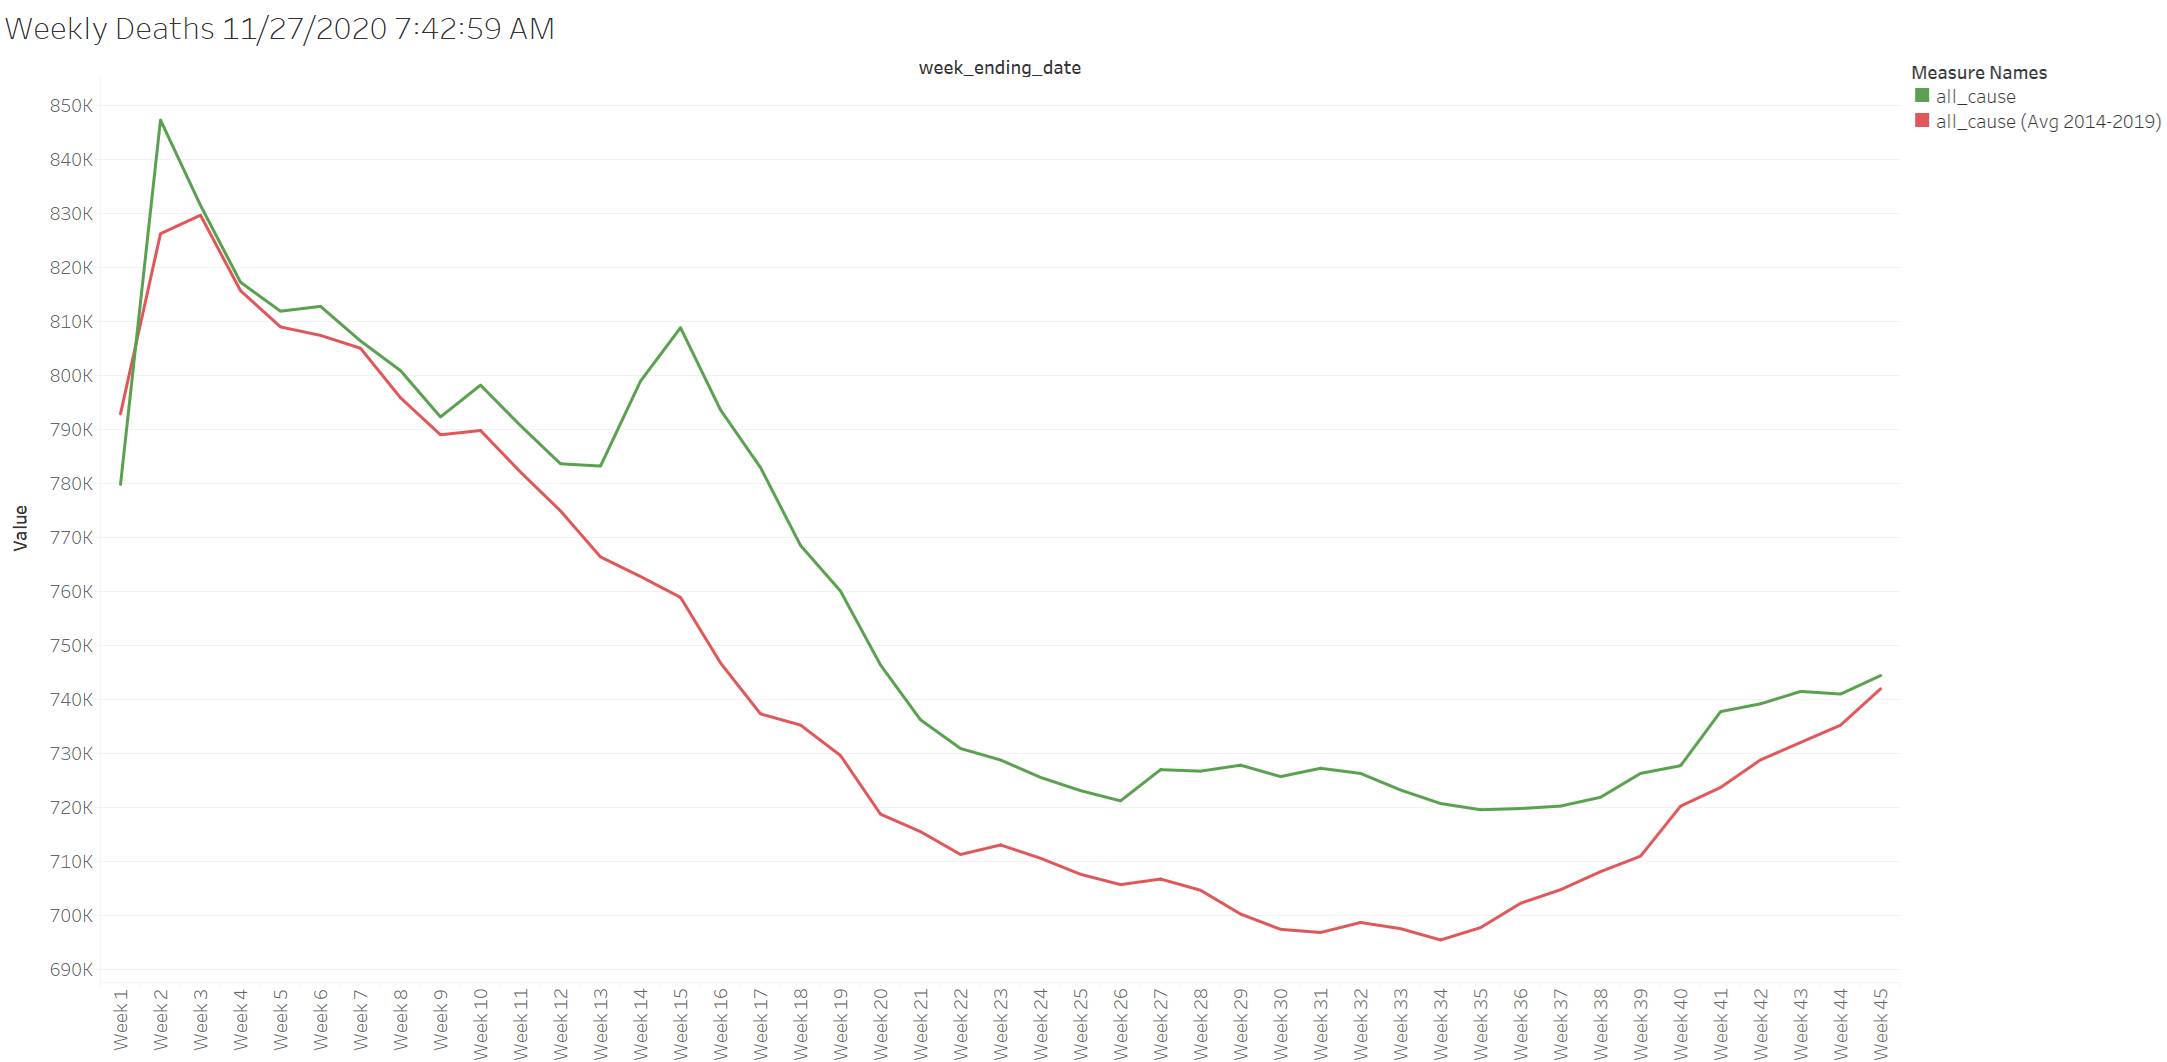
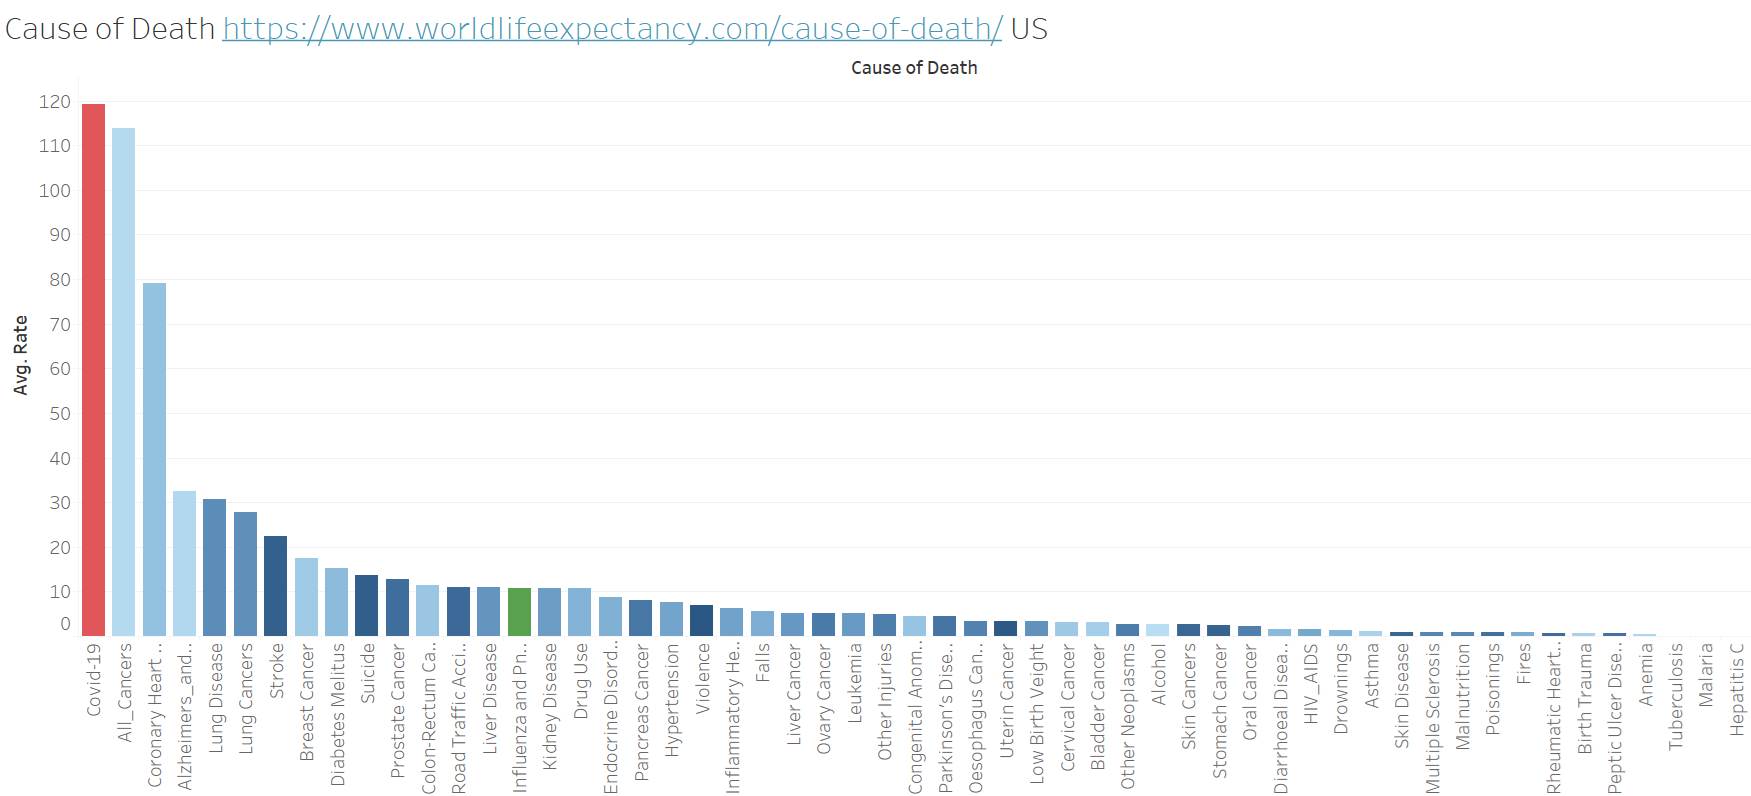
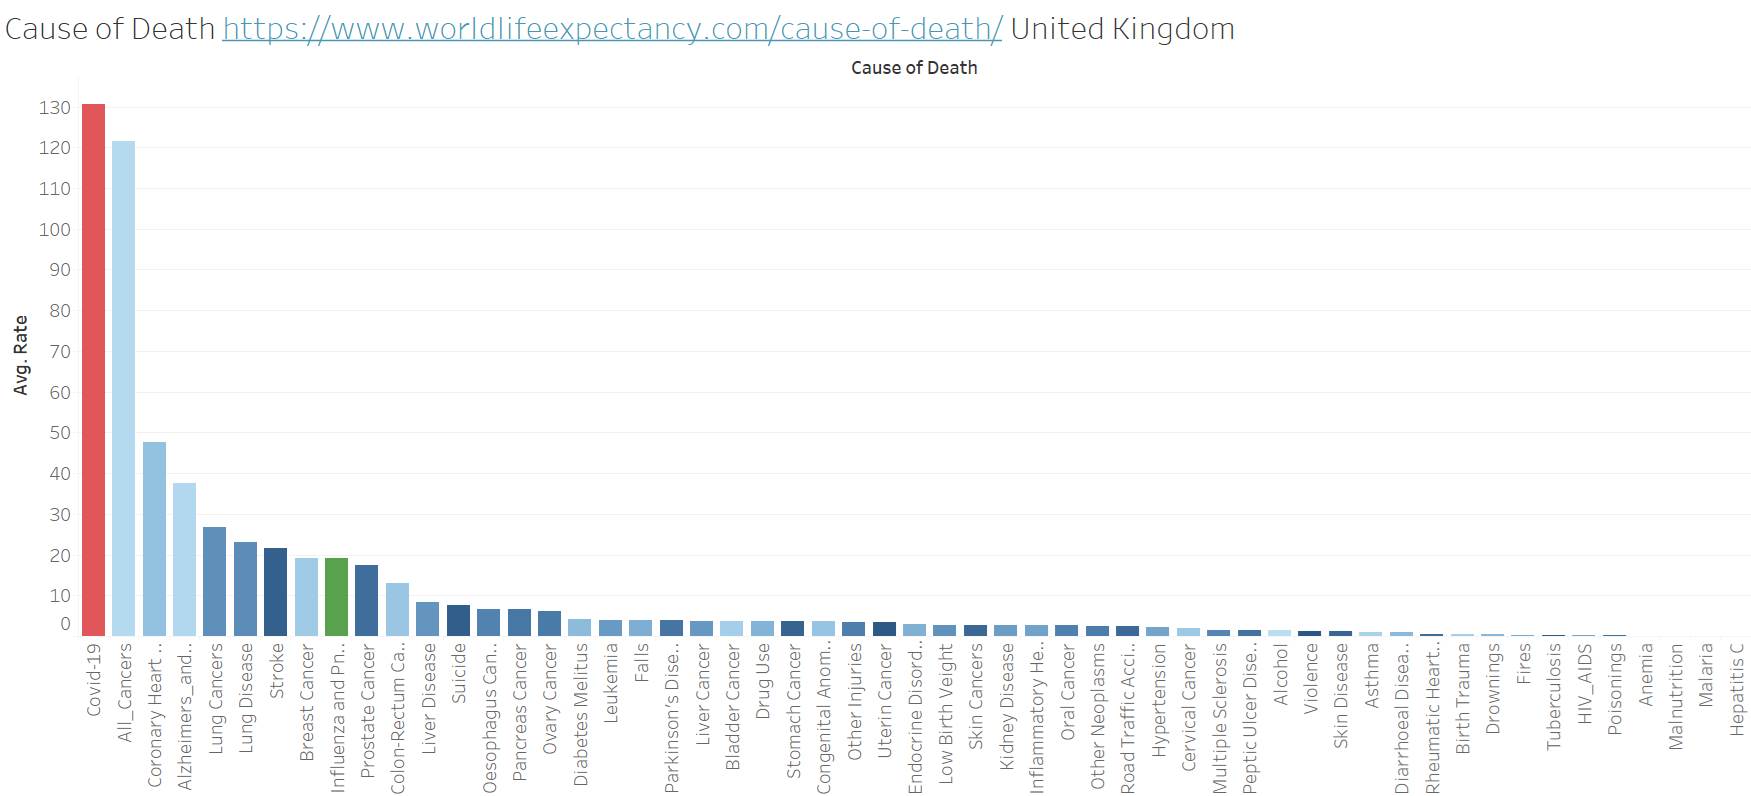
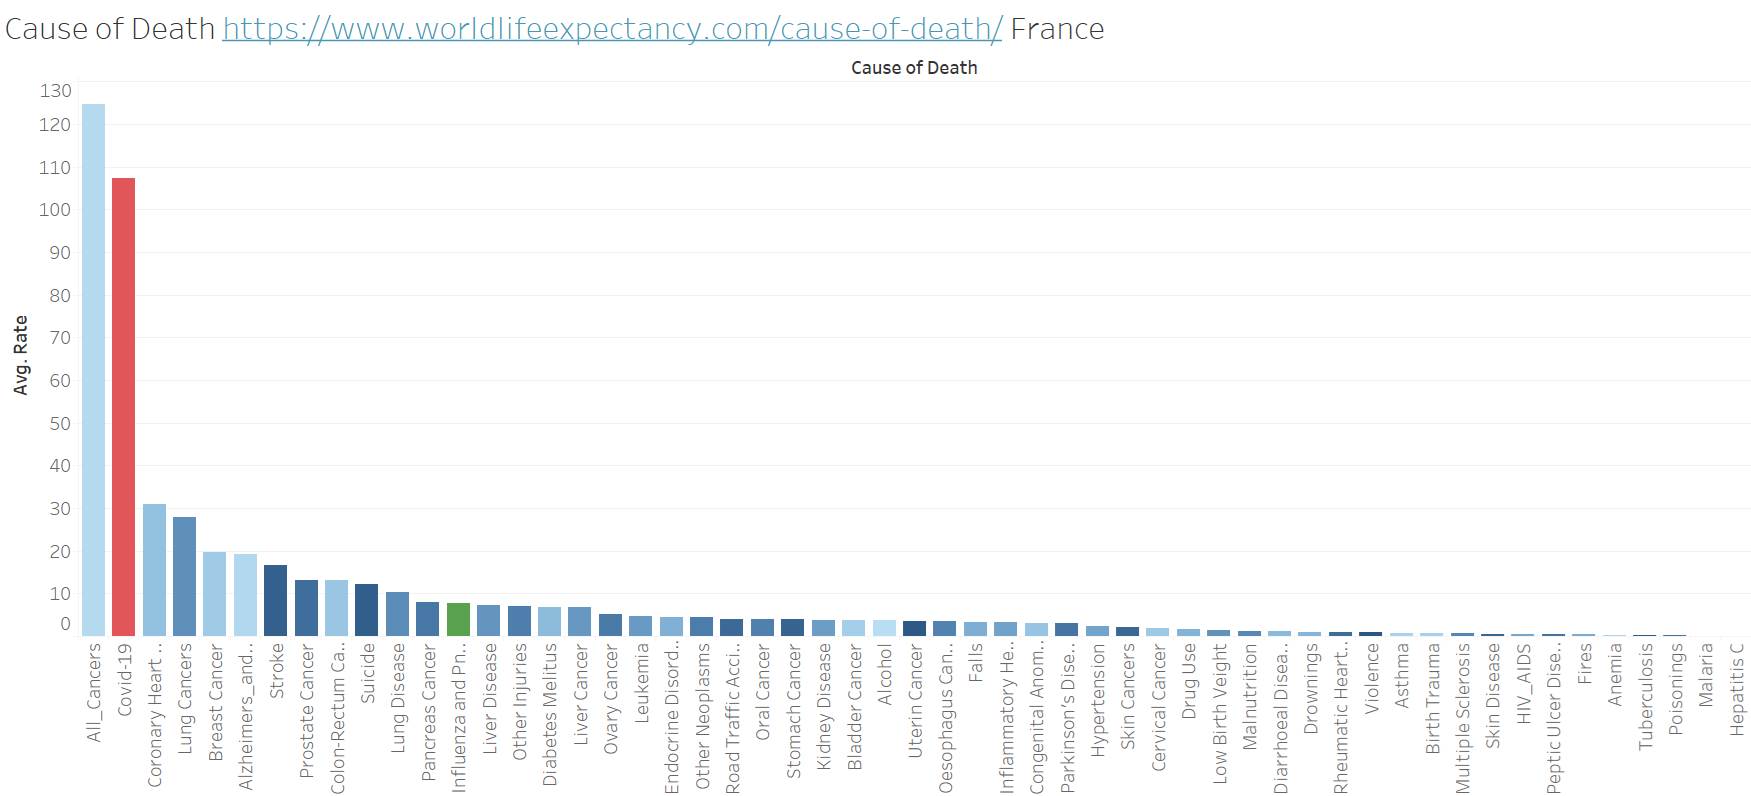
Covid now has overtaken the #1 reason for death in US for the year….Below we compare the deaths from various issues noted in the past – now covid is exceeding all those categories including combining all cancers! Now perhaps this is an over reporting of Covid and other categories we should see a reduction – but we do have excess deaths in the US. Not sure about the rest of the country as I don’t have that data yet.
US Excess Death Weekly Chart (Difference between Green and Red Line Represents the additional deaths than typical year)
US showing Covid leading cause of death
UK in same boat
France still below cancer
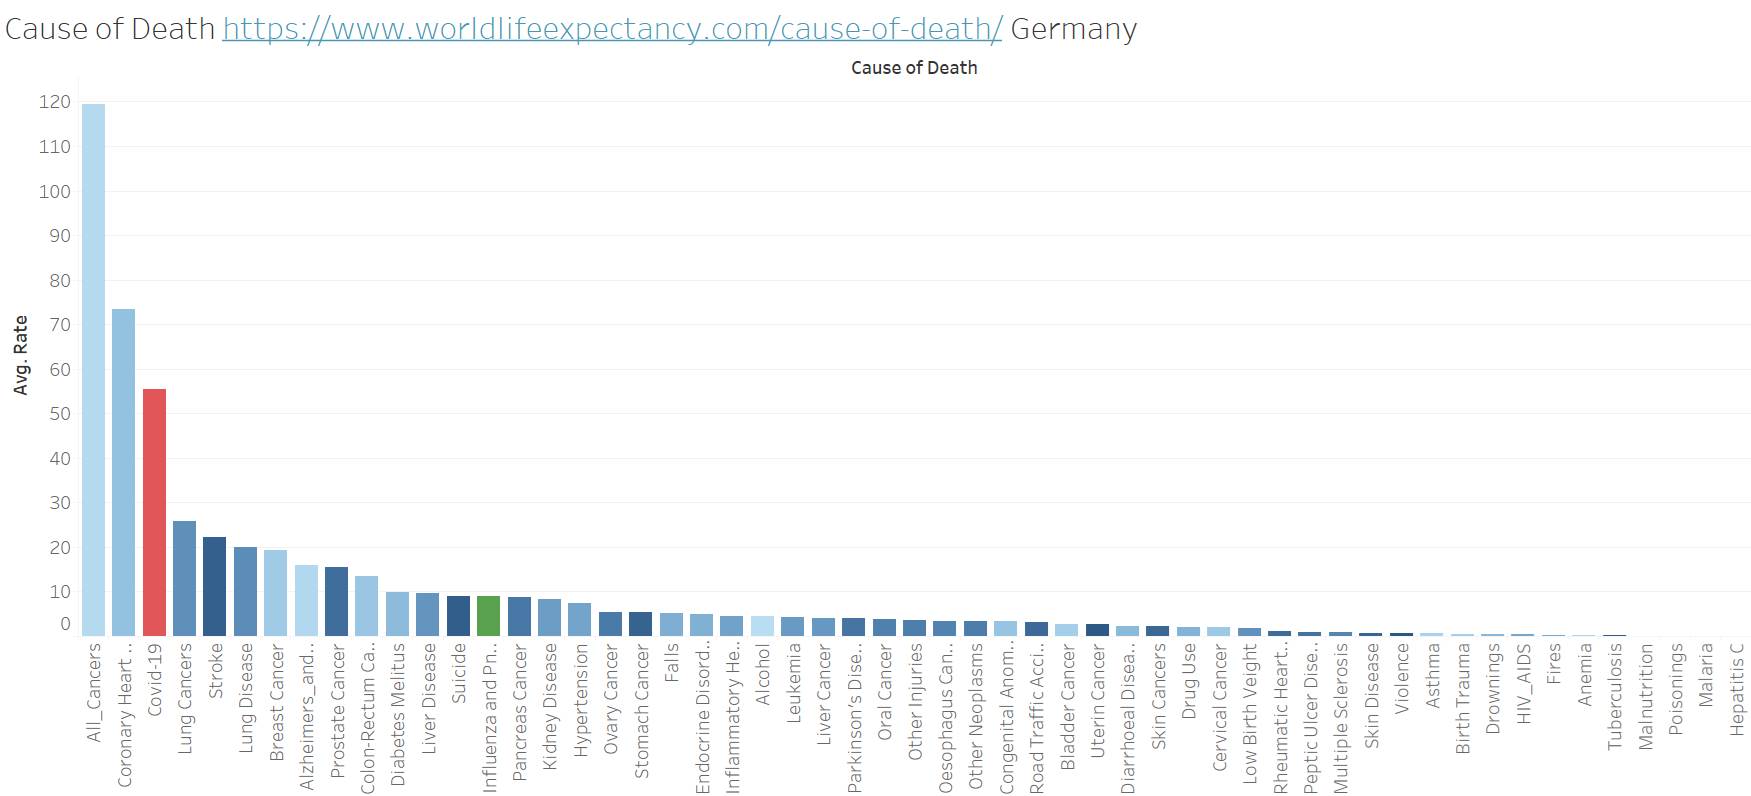
Germany still below all cancer and heart disease
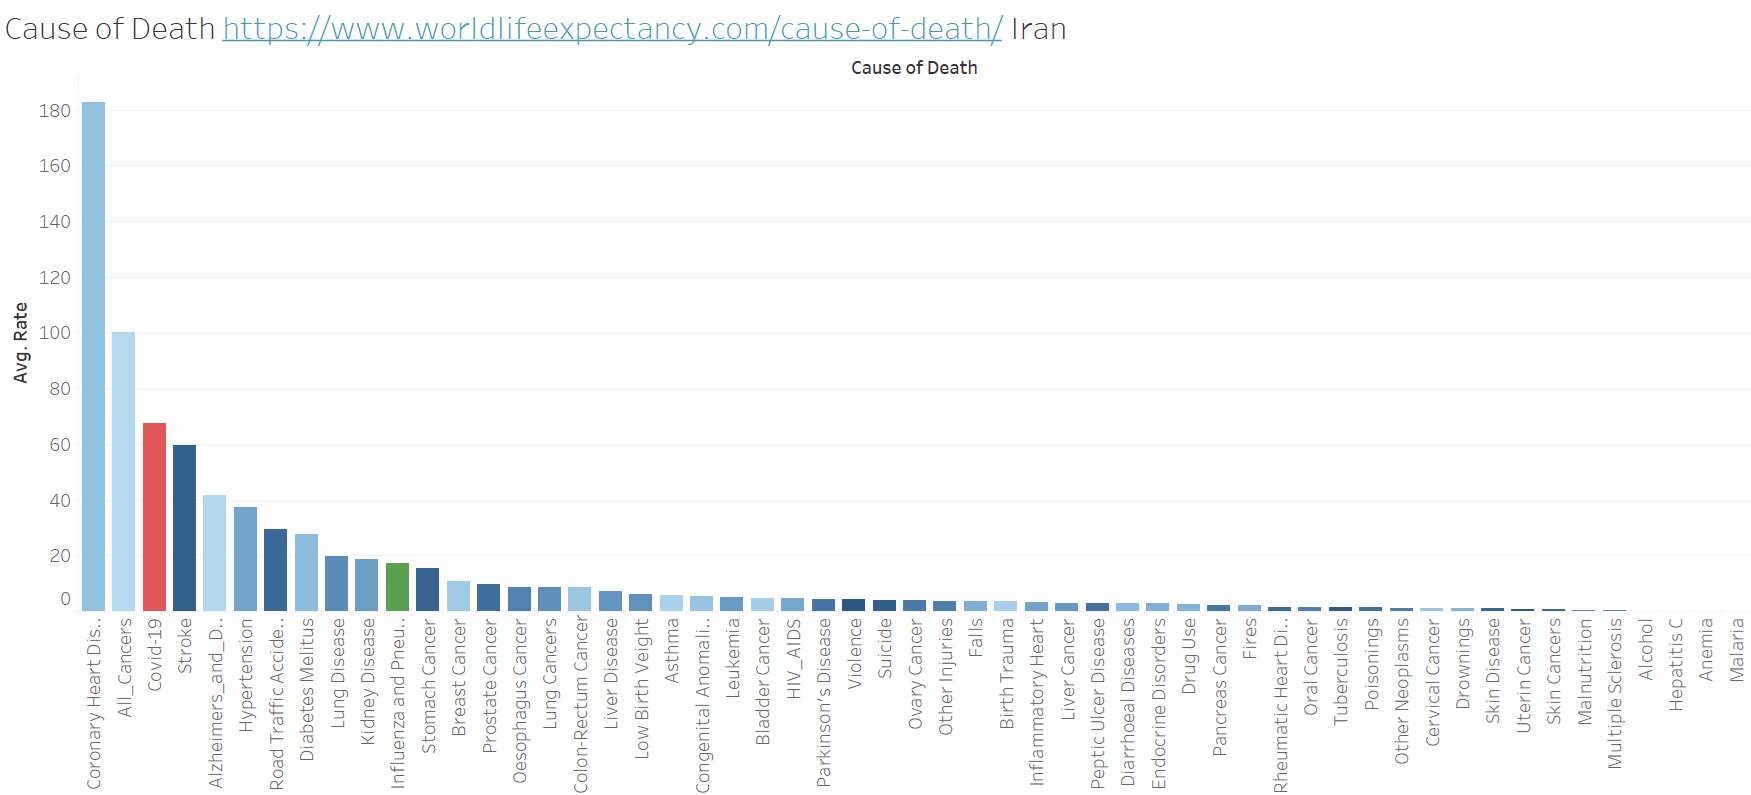
Iran similar to Germany but with Heart disease leading death
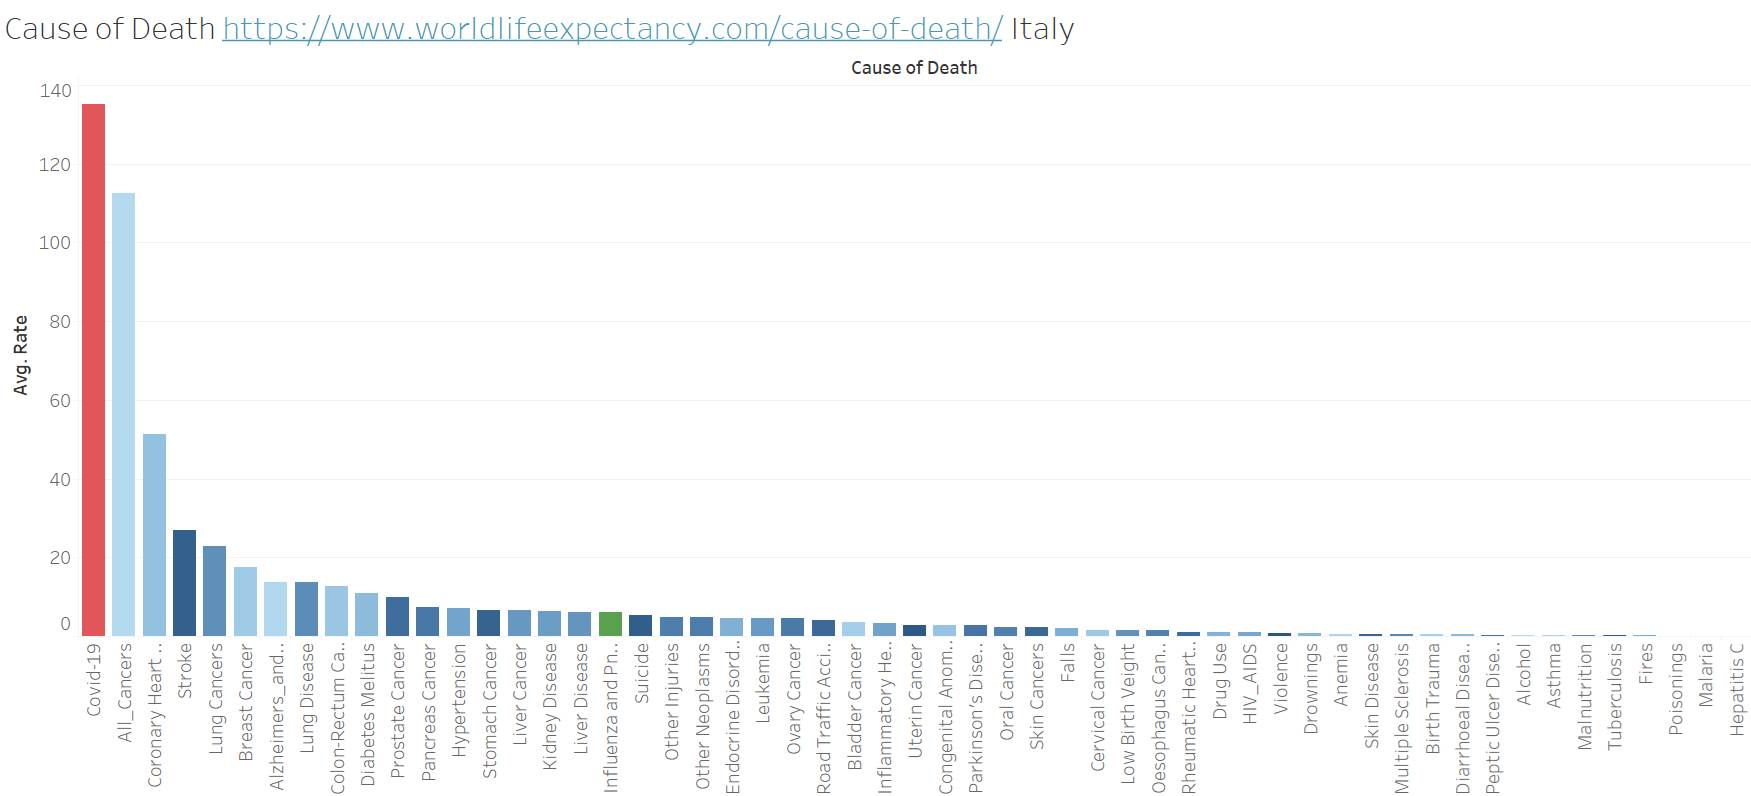
Italy similar to US and UK
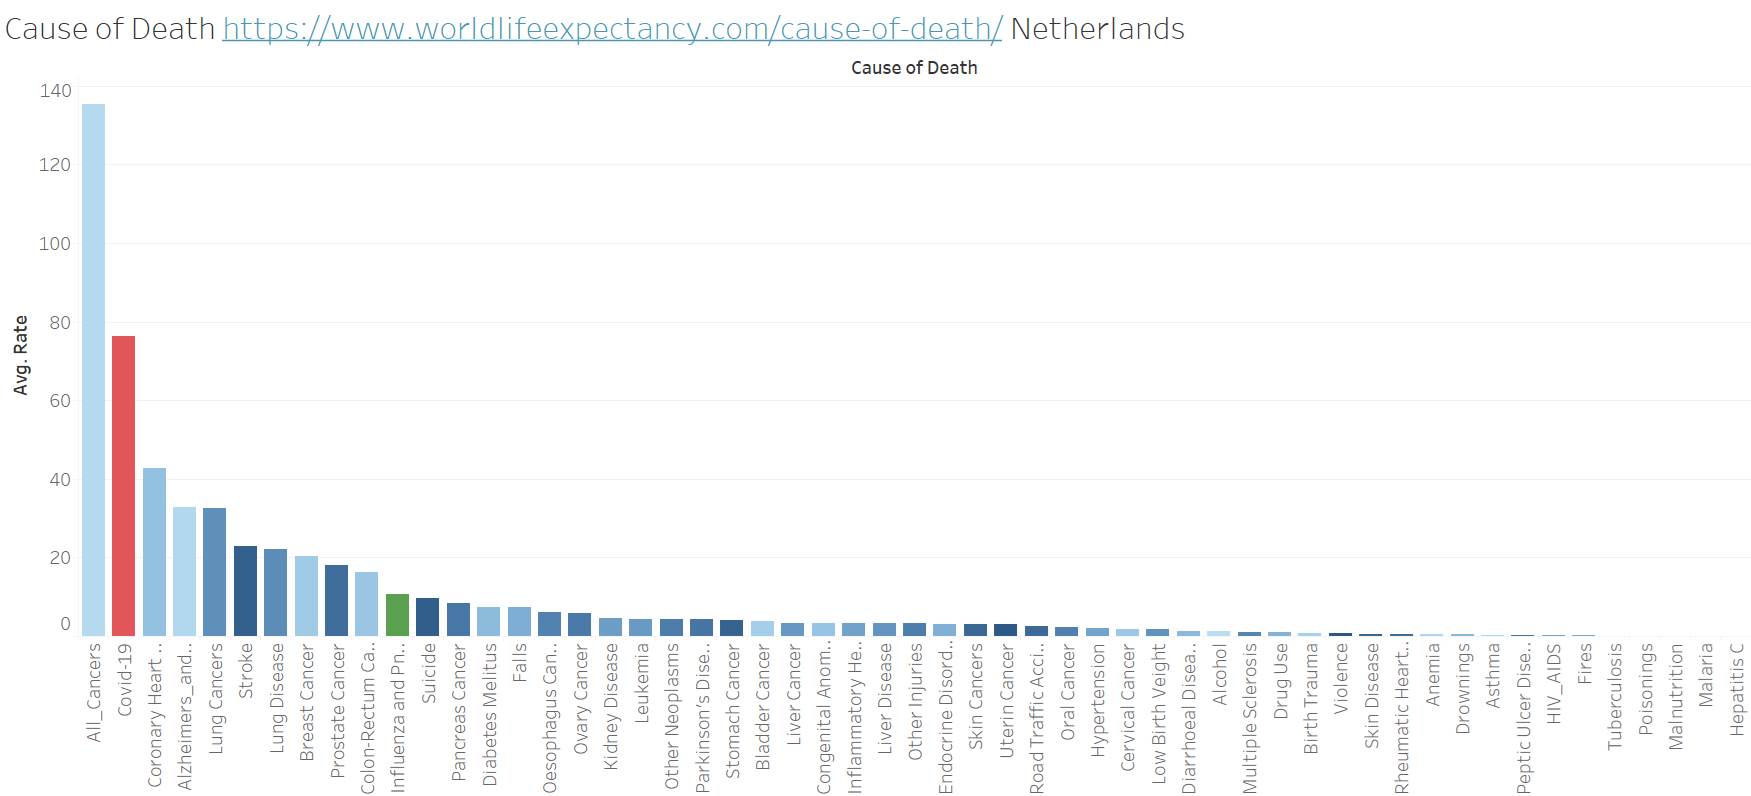
Netherlands Cancer issue still far ahead of Covid – but Covid is second place.
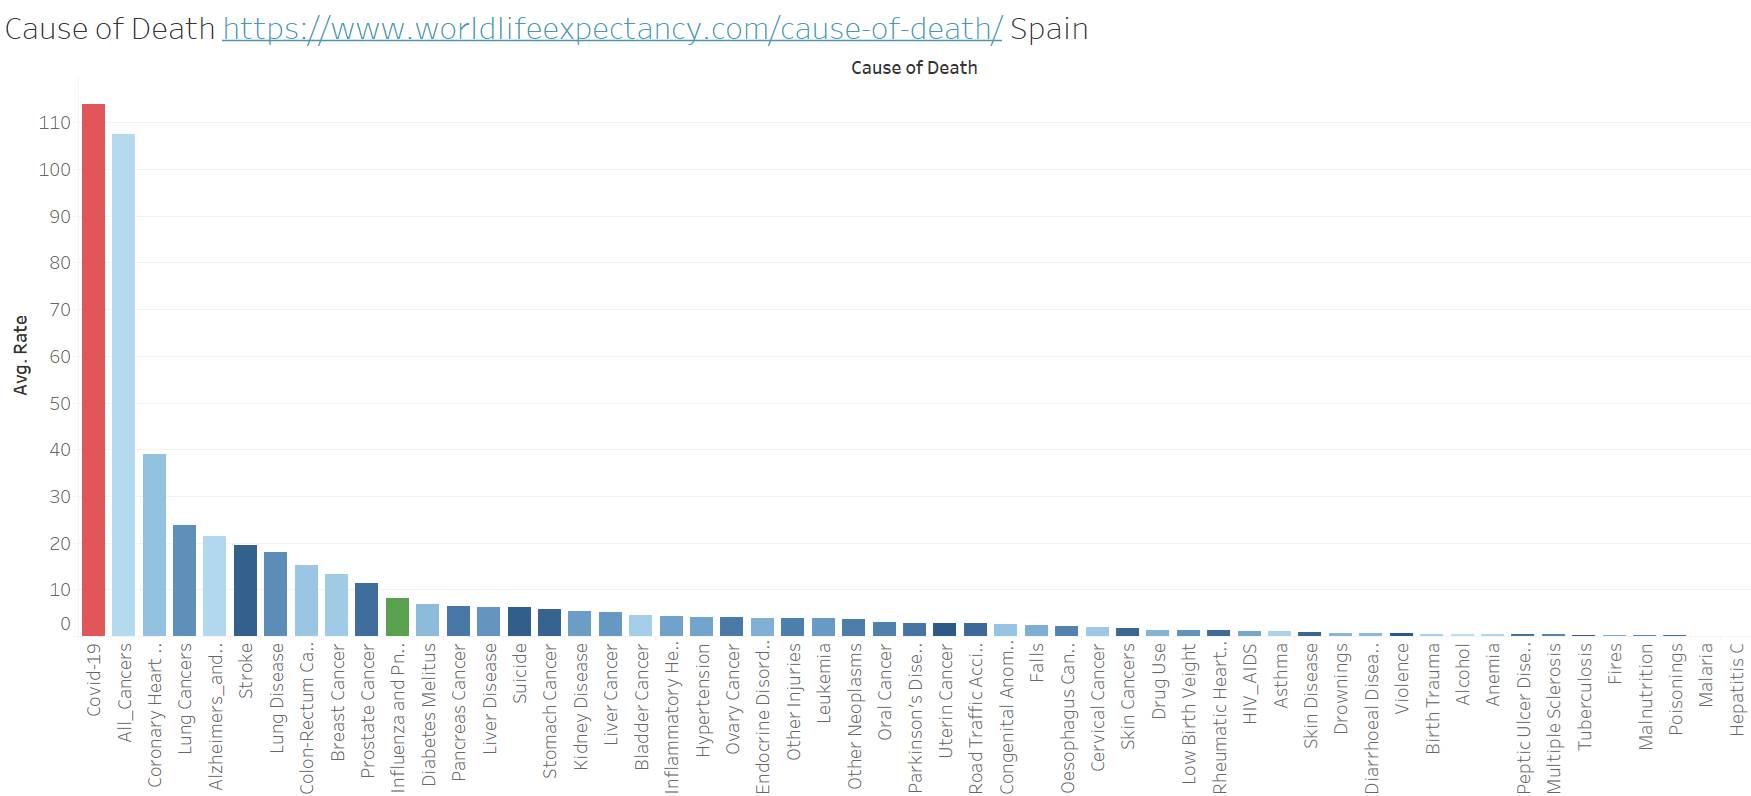
Spain similar to US and UK
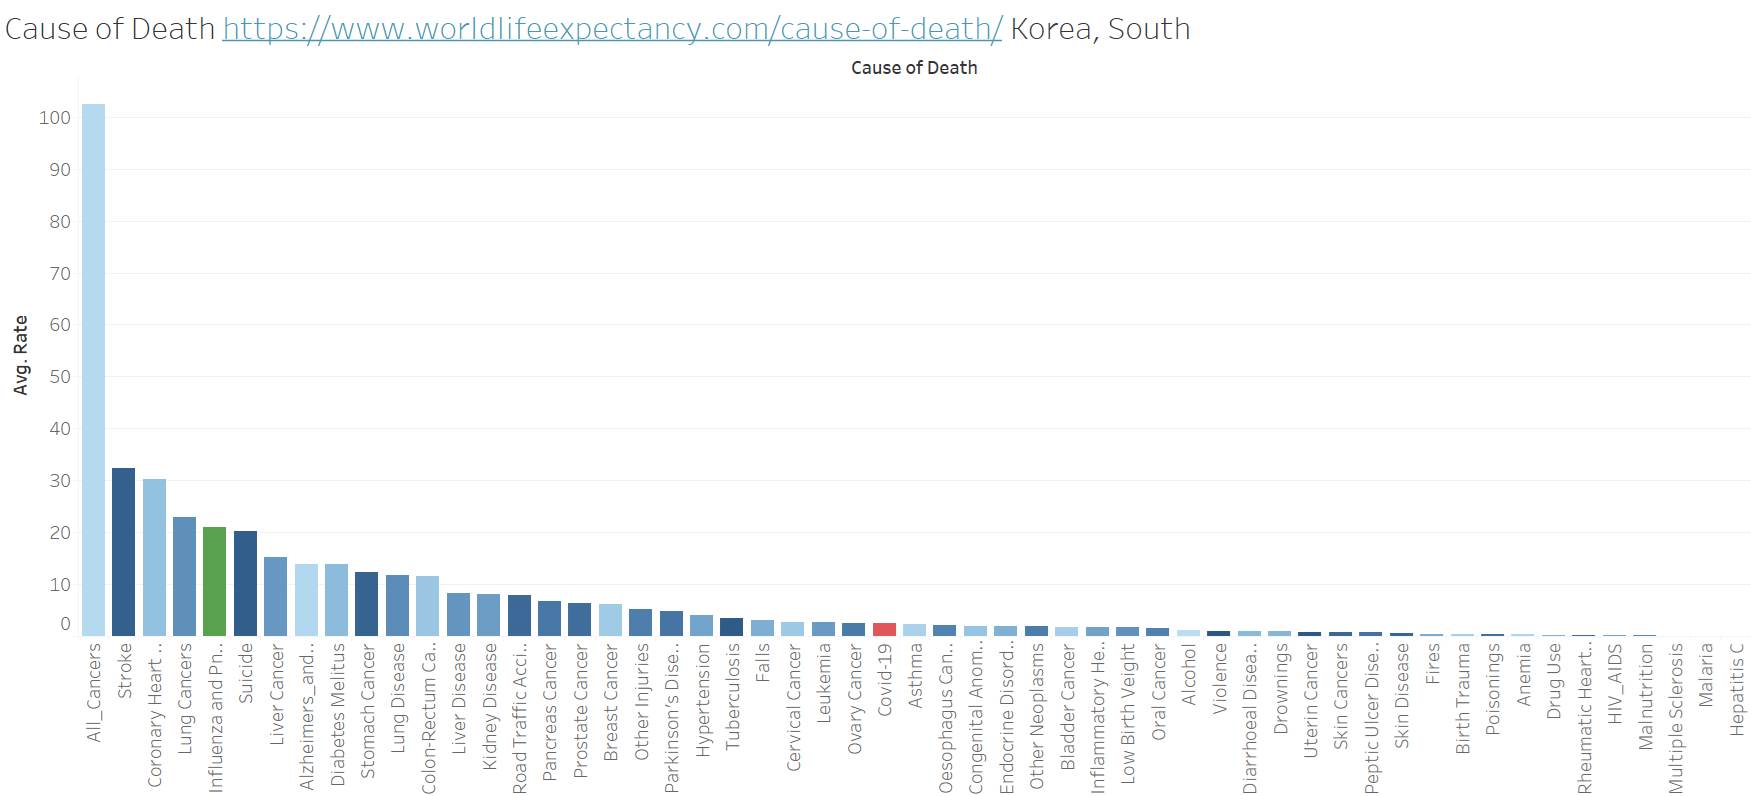
S. Korea is an amazing chart when viewing all the above….so far down the list is covid
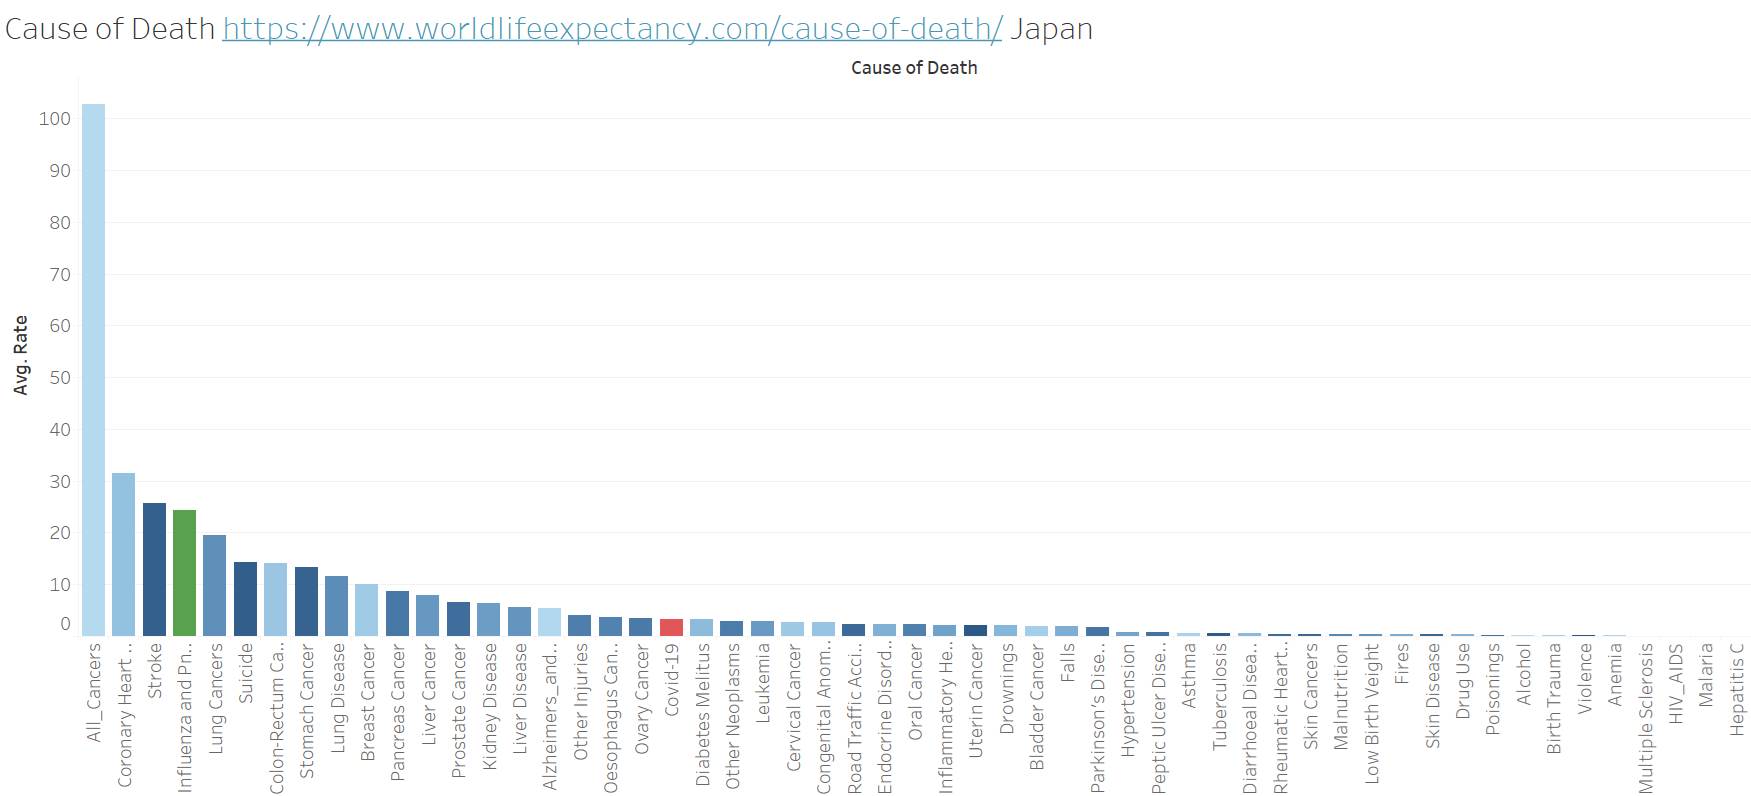
Same in Japan – very stark difference
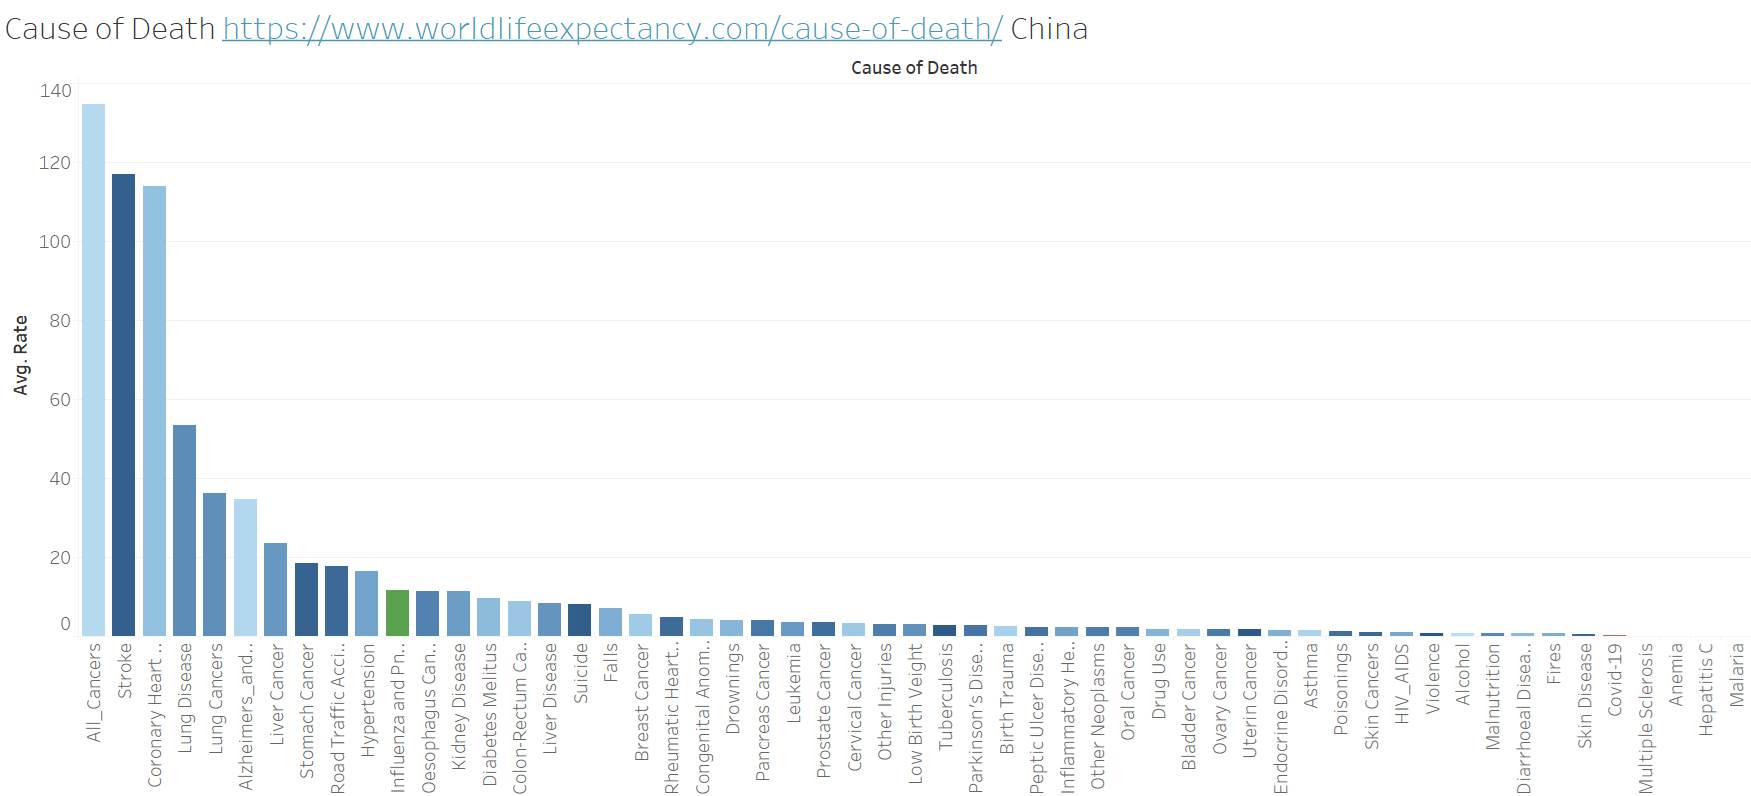
China is extreme – but the numbers have to be questioned at this point – unless of course it was designed this way not to impact them….
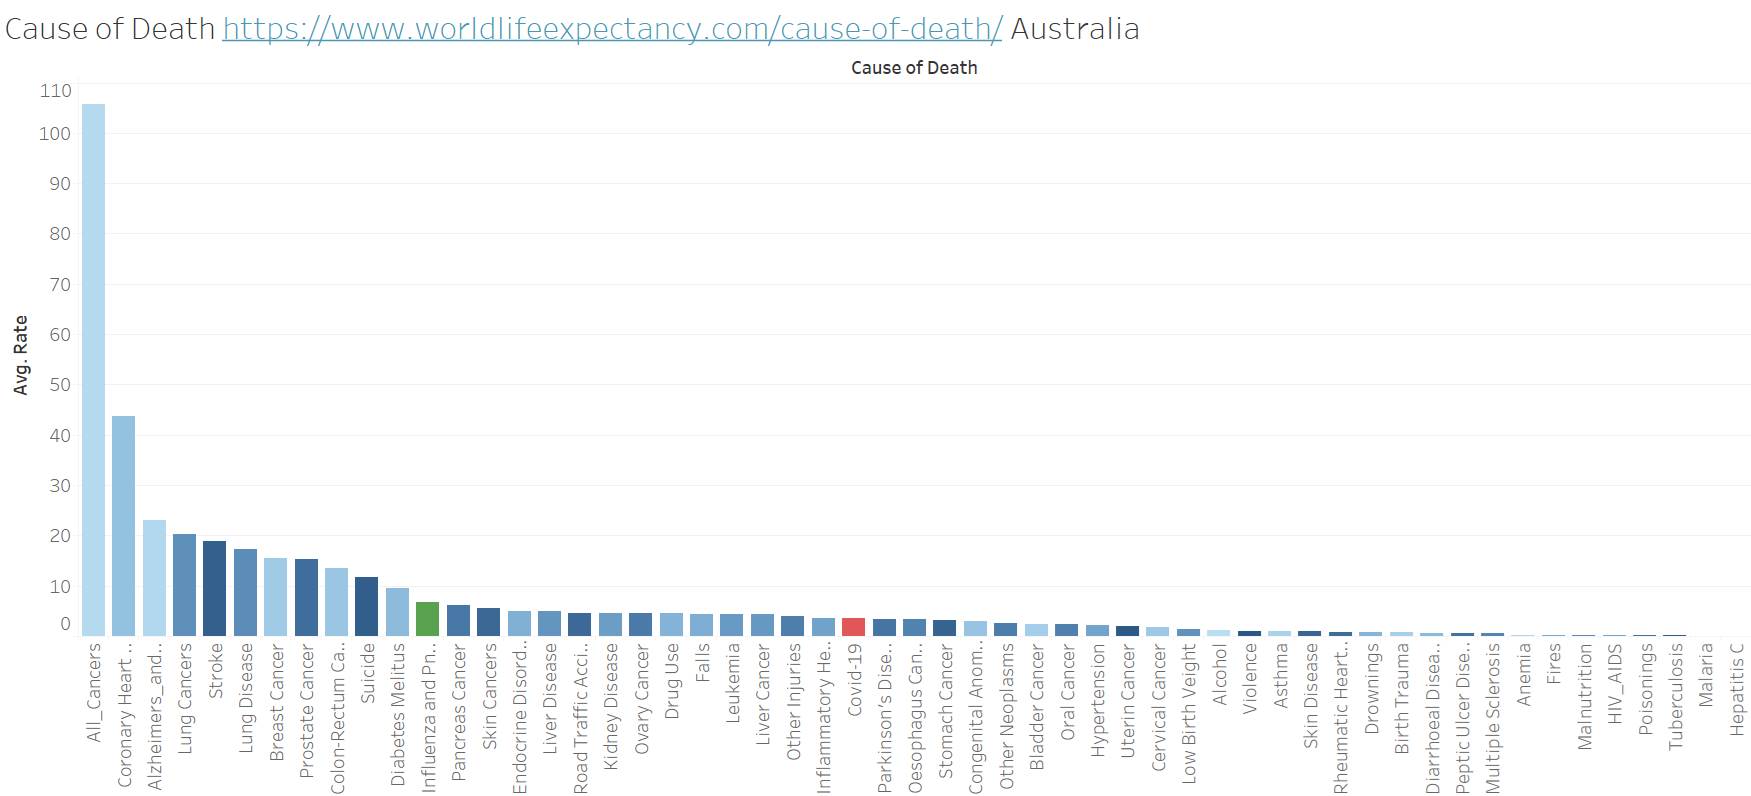
But then we have Australia who is also showing much less covid deaths
New Zealand on the extreme to
S. Africa Covid is a concern but the regular flu is still more deadly there
Brazil almost passing All Cancer to be the top leading death
Similar in Argentina
Argentina similar to US
Canada Covid is second place to All Cancer. All Cancer has a big lead still.
Not a good reporting day for a weekend….
CA leading – TX second – tx back reporting
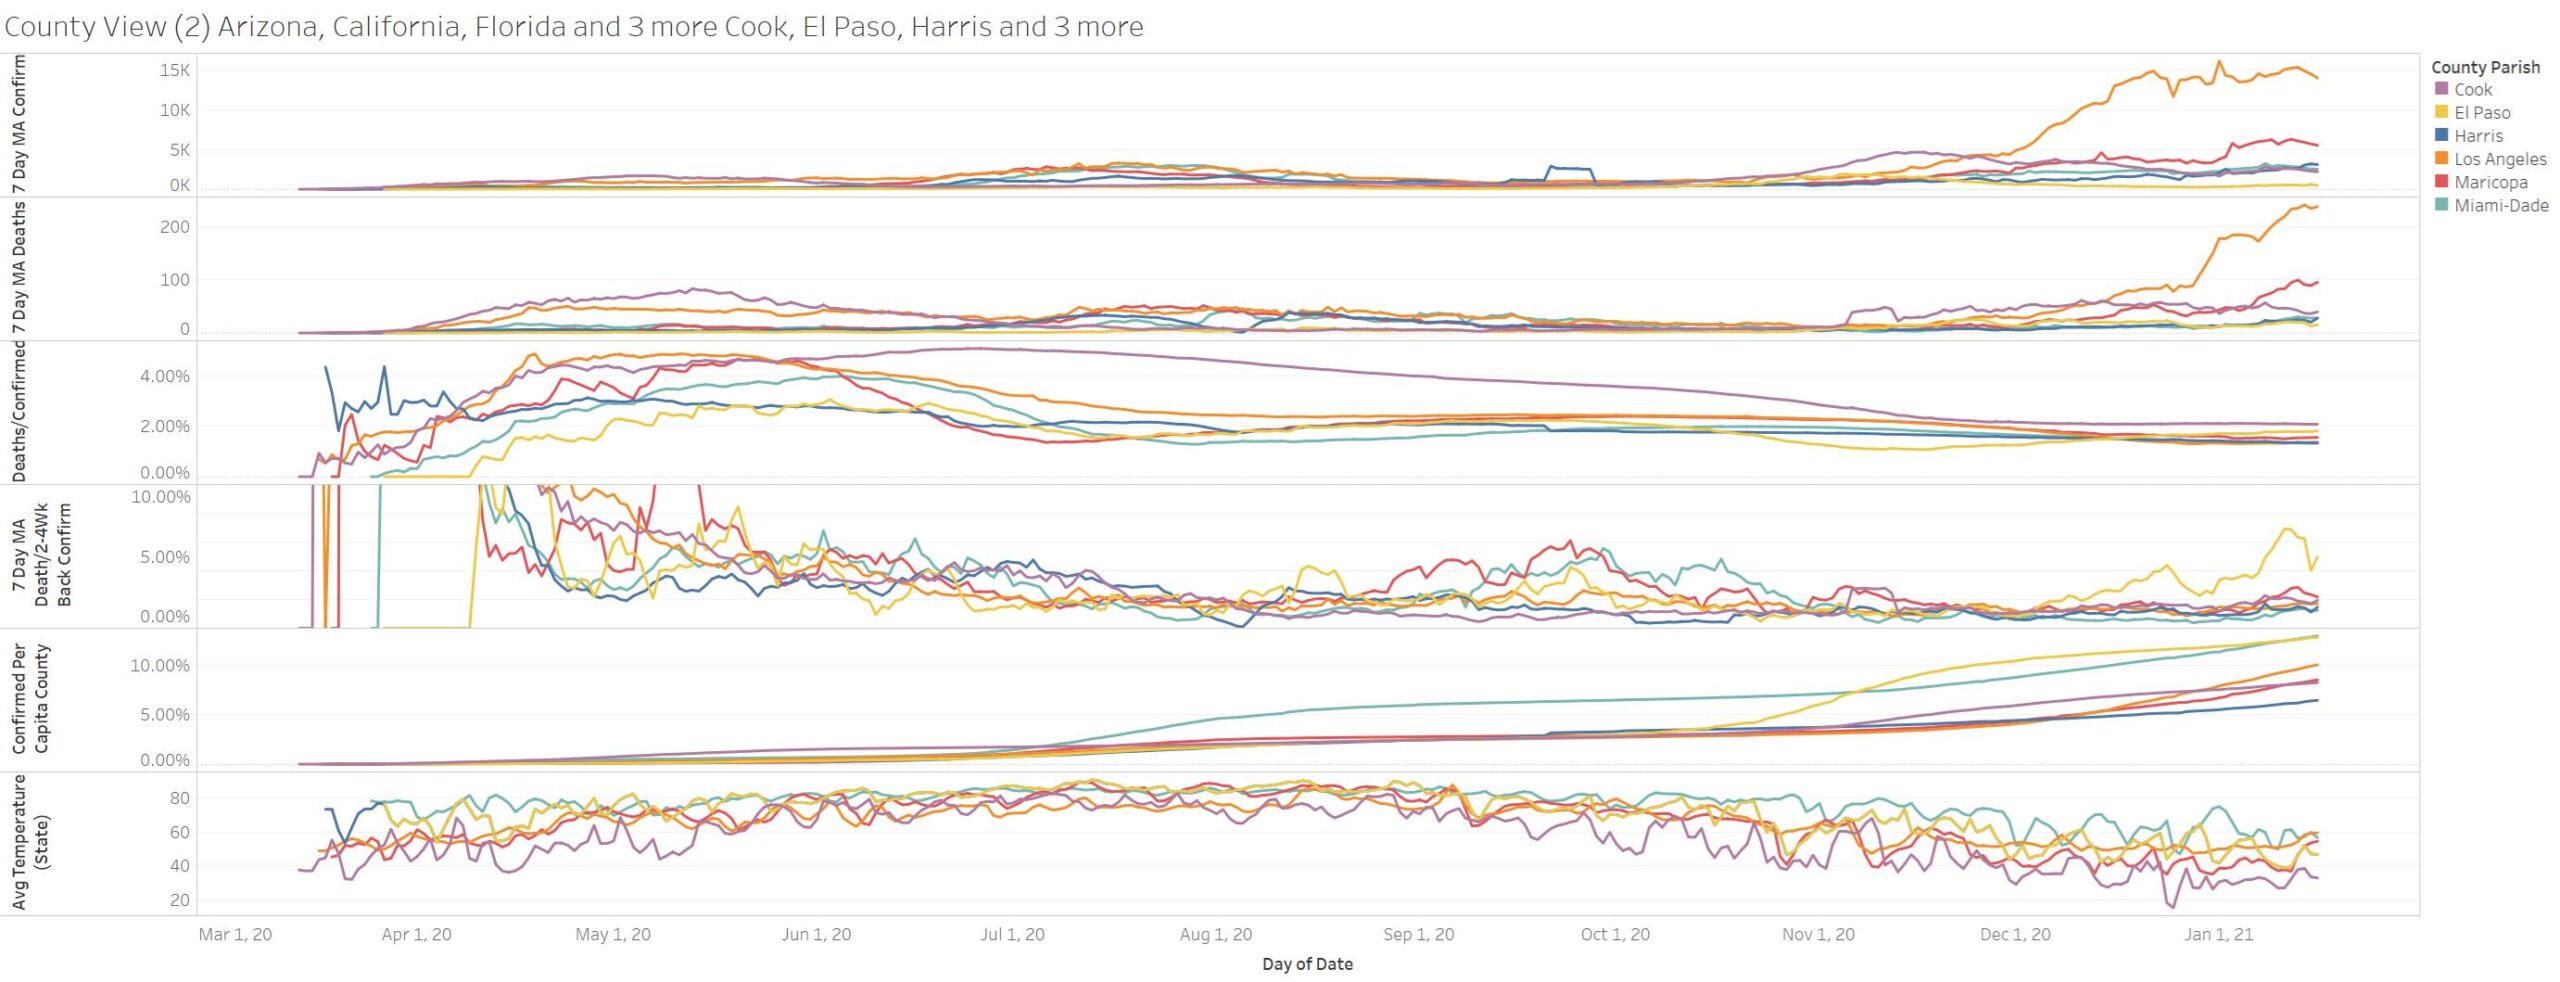
Still county basis its LA in far lead
Not too much dispersion in US
Signs of peaking in LA!
