Covid19mathblog.com
Its been exactly 7 months since the last write up. Why? Because the corona virus has similar structure as a common cold virus. As noted several times before the virus encapsulates itself in the cold thereby sustaining itself longer vs. the summer time – and hence you get the cold/flu season. You do have a bump in the summer time but as explained before the HVAC is heavily running in the south and inside those systems it gets cold enough for the virus to encapsulate and then being too hot to go outside many stay inside not aware the place is not well ventilated. Ventilation is the key and will always be one of the easiest things to focus on and actually have a material impact.
The US has not begun its upward trend as seen in the last two years but that’s largely as its been warm. This years accumulation of confirmations is up year on year. Deaths are actually lower year on year showing a much better outcome – perhaps this can be contributed to the vaccine. IF it was largely vaccine driven then fatality rates in the younger segments would have improved. If the vaccine was equally effective for ALL age group the breakdown of deaths by age should look the same as during the time when there was no vaccine.
Below chart we show the age% breakdown of listed covid deaths. The data is what it is – there are likely covid deaths listed that are not actual covid deaths. However this does not mean the data is completely a waste as long as the record keeping was consistent you can still draw some change trends and have curious questions. During the vaccine rollouts we know it was focused on the elderly first and therefore we can see there was a significant improvement to the elderly – at the same time we did change our nursing home practices. However this year 75+ categories has jumped back up. All the categories under 75 improved EXCEPT for the 0-24 which slightly went up. This is reaffirming covid risk is exponentially increasing with age.
If the vaccine actually delivered on its promise then society at some point SHOULD go back to normal levels of deaths. However we can see in the weekly chart not 1 week has hit the average since 2020. People are still dying at much higher levels in the past. Something is still not right. Below chart the red is the baseline (2014-2019 average deaths of ALL Causes) – the green and the various shapes represents the various years. 14% more deaths this summer than the previous baseline. There are lots of articles and media presentations about sudden deaths – largely as result of heart condition. Obviously with more people getting covid one could say that the after effects are potentially causing these deaths. There was a study to look at this https://www.mdpi.com/2077-0383/11/8/2219
“Retrospective cohort study of 196,992 adults after COVID-19 infection in Clalit Health Services members in Israel between March 2020 and January 2021. Inpatient myocarditis and pericarditis diagnoses were retrieved from day 10 after positive PCR. Follow-up was censored on 28 February 2021, with minimum observation of 18 days. The control cohort of 590,976 adults with at least one negative PCR and no positive PCR were age- and sex-matched.”
“Post COVID-19 infection was not associated with either myocarditis (aHR 1.08; 95% CI 0.45 to 2.56) or pericarditis (aHR 0.53; 95% CI 0.25 to 1.13). We did not observe an increased incidence of neither pericarditis nor myocarditis in adult patients recovering from COVID-19 infection.”
IF true this is concerning – as infection of covid is not driving myocarditis – whereas there are reports showing the vaccine showing signs of resulting in myocarditis.
Perhaps many want to go back to mask or more vaccinations to solve this problem – UNLESS the vaccines improve those two solutions do not show societal benefit. They do show individual benefits for certain demographics.
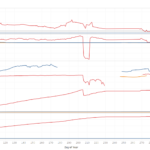
The best way to look at those issues is to look at last winter with the large jump in confirmations and compare within the state the counties with mandates and those without. The charts would show IF effective the counties with mask vs without mask have lower confirmation per capita (spreadability). The counties with higher vaccines rates should also show lower confirmation per capita IF the vaccine was offering societal benefits. Reality is reality and perhaps there are legitimate reasons for this which at this time is likely human behavior. The results are presented below and actually shows the more vaccinated the more spreading occurs – and this is likely due to behavior – the more vaccinated the more leaving your guard down? Nothing clear on mask mandates. Doesn’t show any significance.
Zoom of Michigan winter – no clear societal value for spreading covid for vaccine or mask.
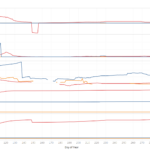
Overlapping the extreme states in terms of policy CA & NY vs FL & TX – there was no discernable value in mitigating spread via vaccination or local policies.
Balancing the mask discussion this study shows mask was a significant variable is spread. https://www.medrxiv.org/content/10.1101/2022.08.09.22278385v1.full.pdf
“ We estimate that lifting of school masking requirements was associated with an additional 44.9 (95% CI: 32.6, 57.1) COVID-19
cases per 1,000 students and staff over the 15 weeks since the lifting of the statewide school masking
requirement, representing nearly 30% of all cases observed in schools during that time”
A few questions come to mind in reading the study – the amount of testing that occurred was it uniformed from district with and without mask mandates? How accurate is the school reporting system relative to the federal reporting system? Do the county data match with school district results? IF true perhaps the micro control setting of a school and officials that can control the student body makes the mask more effective. In the societal view above it is not showing this result.
The two countries who did follow draconian methods are seeing very high confirmations this year relative to past years – New Zealand & China.
The benefit in delaying society open is two fold – a vaccine could be developed so the spread can stopped – treatment could be developed so if you got sick the odds of dying is less. What actually transpired is now the vaccine is a prophylactic and helps you not get as sick and/or die. The vaccine does not help stop the spread so the first value of draconian measures is not working out for NZ and China. Hopefully the vaccine is preventing enough deaths to make up for the societal disruptions particularly for the youth and the active society.
The infections seems quite inevitable. Looking at just the US and Europe (in theory better reporting) so far the average confirmation per capita is above 30%. This should likely be the expectation that 30% of society be tested and confirmed to have had covid. Based on our China data their confirmation per capita sits below 1%! New Zealand confirmation per capita is now at 40%.
Likely the data is wrong from China but it would have to be many times wrong as they have a lot of confirmations coming to them. With the current vaccines trying to trap the virus from spreading is an impossible task unless you plan to closed down society for a very long time.
The US leads in deaths 360. Confirmation leaders is Japan. (the clean city as everyone was noting in the beginning). The confirmation per capita level they are at 19% – so they still have some more confirmations coming. France is over 57% confirmed.
On the US front we have NY leading confirmation and FL leading deaths. No matter what policy the confirmation of all states over 20%. Infection is inevitable and the vaccines did not deliver as initially promised in terms of stopping the spread.
County view LA leads the confirmation pack nearly 2000 – still lots of testing!


